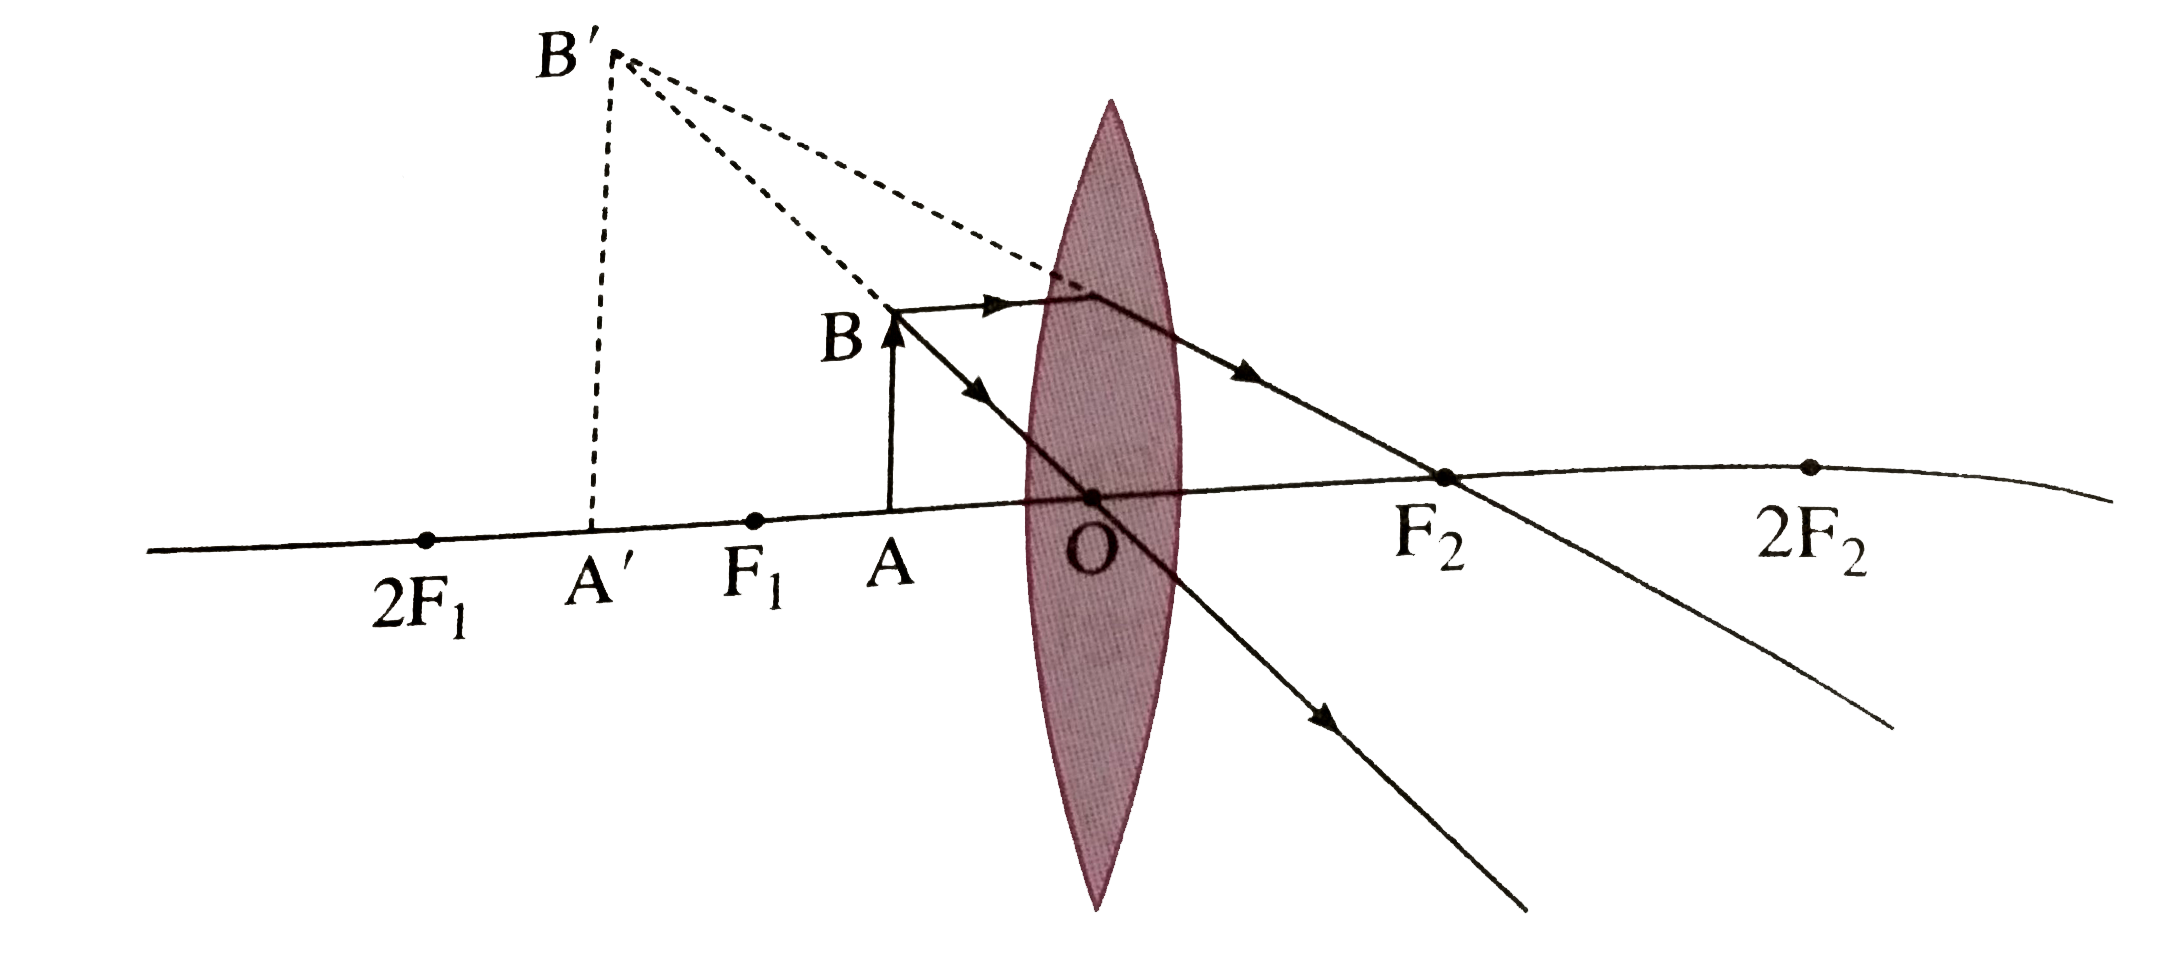
Observe the following table

a - iii, b -i,c -ii
a - ii, b -i, c-iii
a - ii, b - iii, c-i
a - iii, b - ii, c - i
The correct Answer is:C
a - ii, b - iii, c-i
Topper's Solved these Questions
- DEPARTMENTAL MODEL QUESTION PAPER - 1BOOK - CPC CAMBRIDGE PUBLICATIONCHAPTER - DEPARTMENTAL MODEL QUESTION PAPER - 1EXERCISE - ANSWER THE FOLLOWING QUESTIONS
36 Videos
- CPC MODEL QUESTION PAPER-4BOOK - CPC CAMBRIDGE PUBLICATIONCHAPTER - CPC MODEL QUESTION PAPER-4EXERCISE - ANSWER THE FOLLOWING QUESTIONS
37 Videos
- DEPARTMENTAL MODEL QUESTION PAPER - 2BOOK - CPC CAMBRIDGE PUBLICATIONCHAPTER - DEPARTMENTAL MODEL QUESTION PAPER - 2EXERCISE - ANSWER THE FOLLOWING QUESTIONS
37 Videos
Similar Questions
Knowledge Check
Rahul, a class 8 student conducted the following experiment and recorded the observations in the given table.
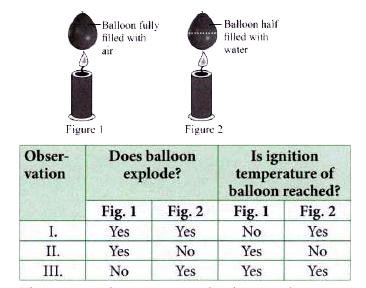
The correct observation and inference drawn areAI, balloon has a higher ignition temperature than water hence, it explodesBII, water increases the melting point of balloonCIII, water in the balloon absorbs the heatDII, water conducts the heat away from the balloon.
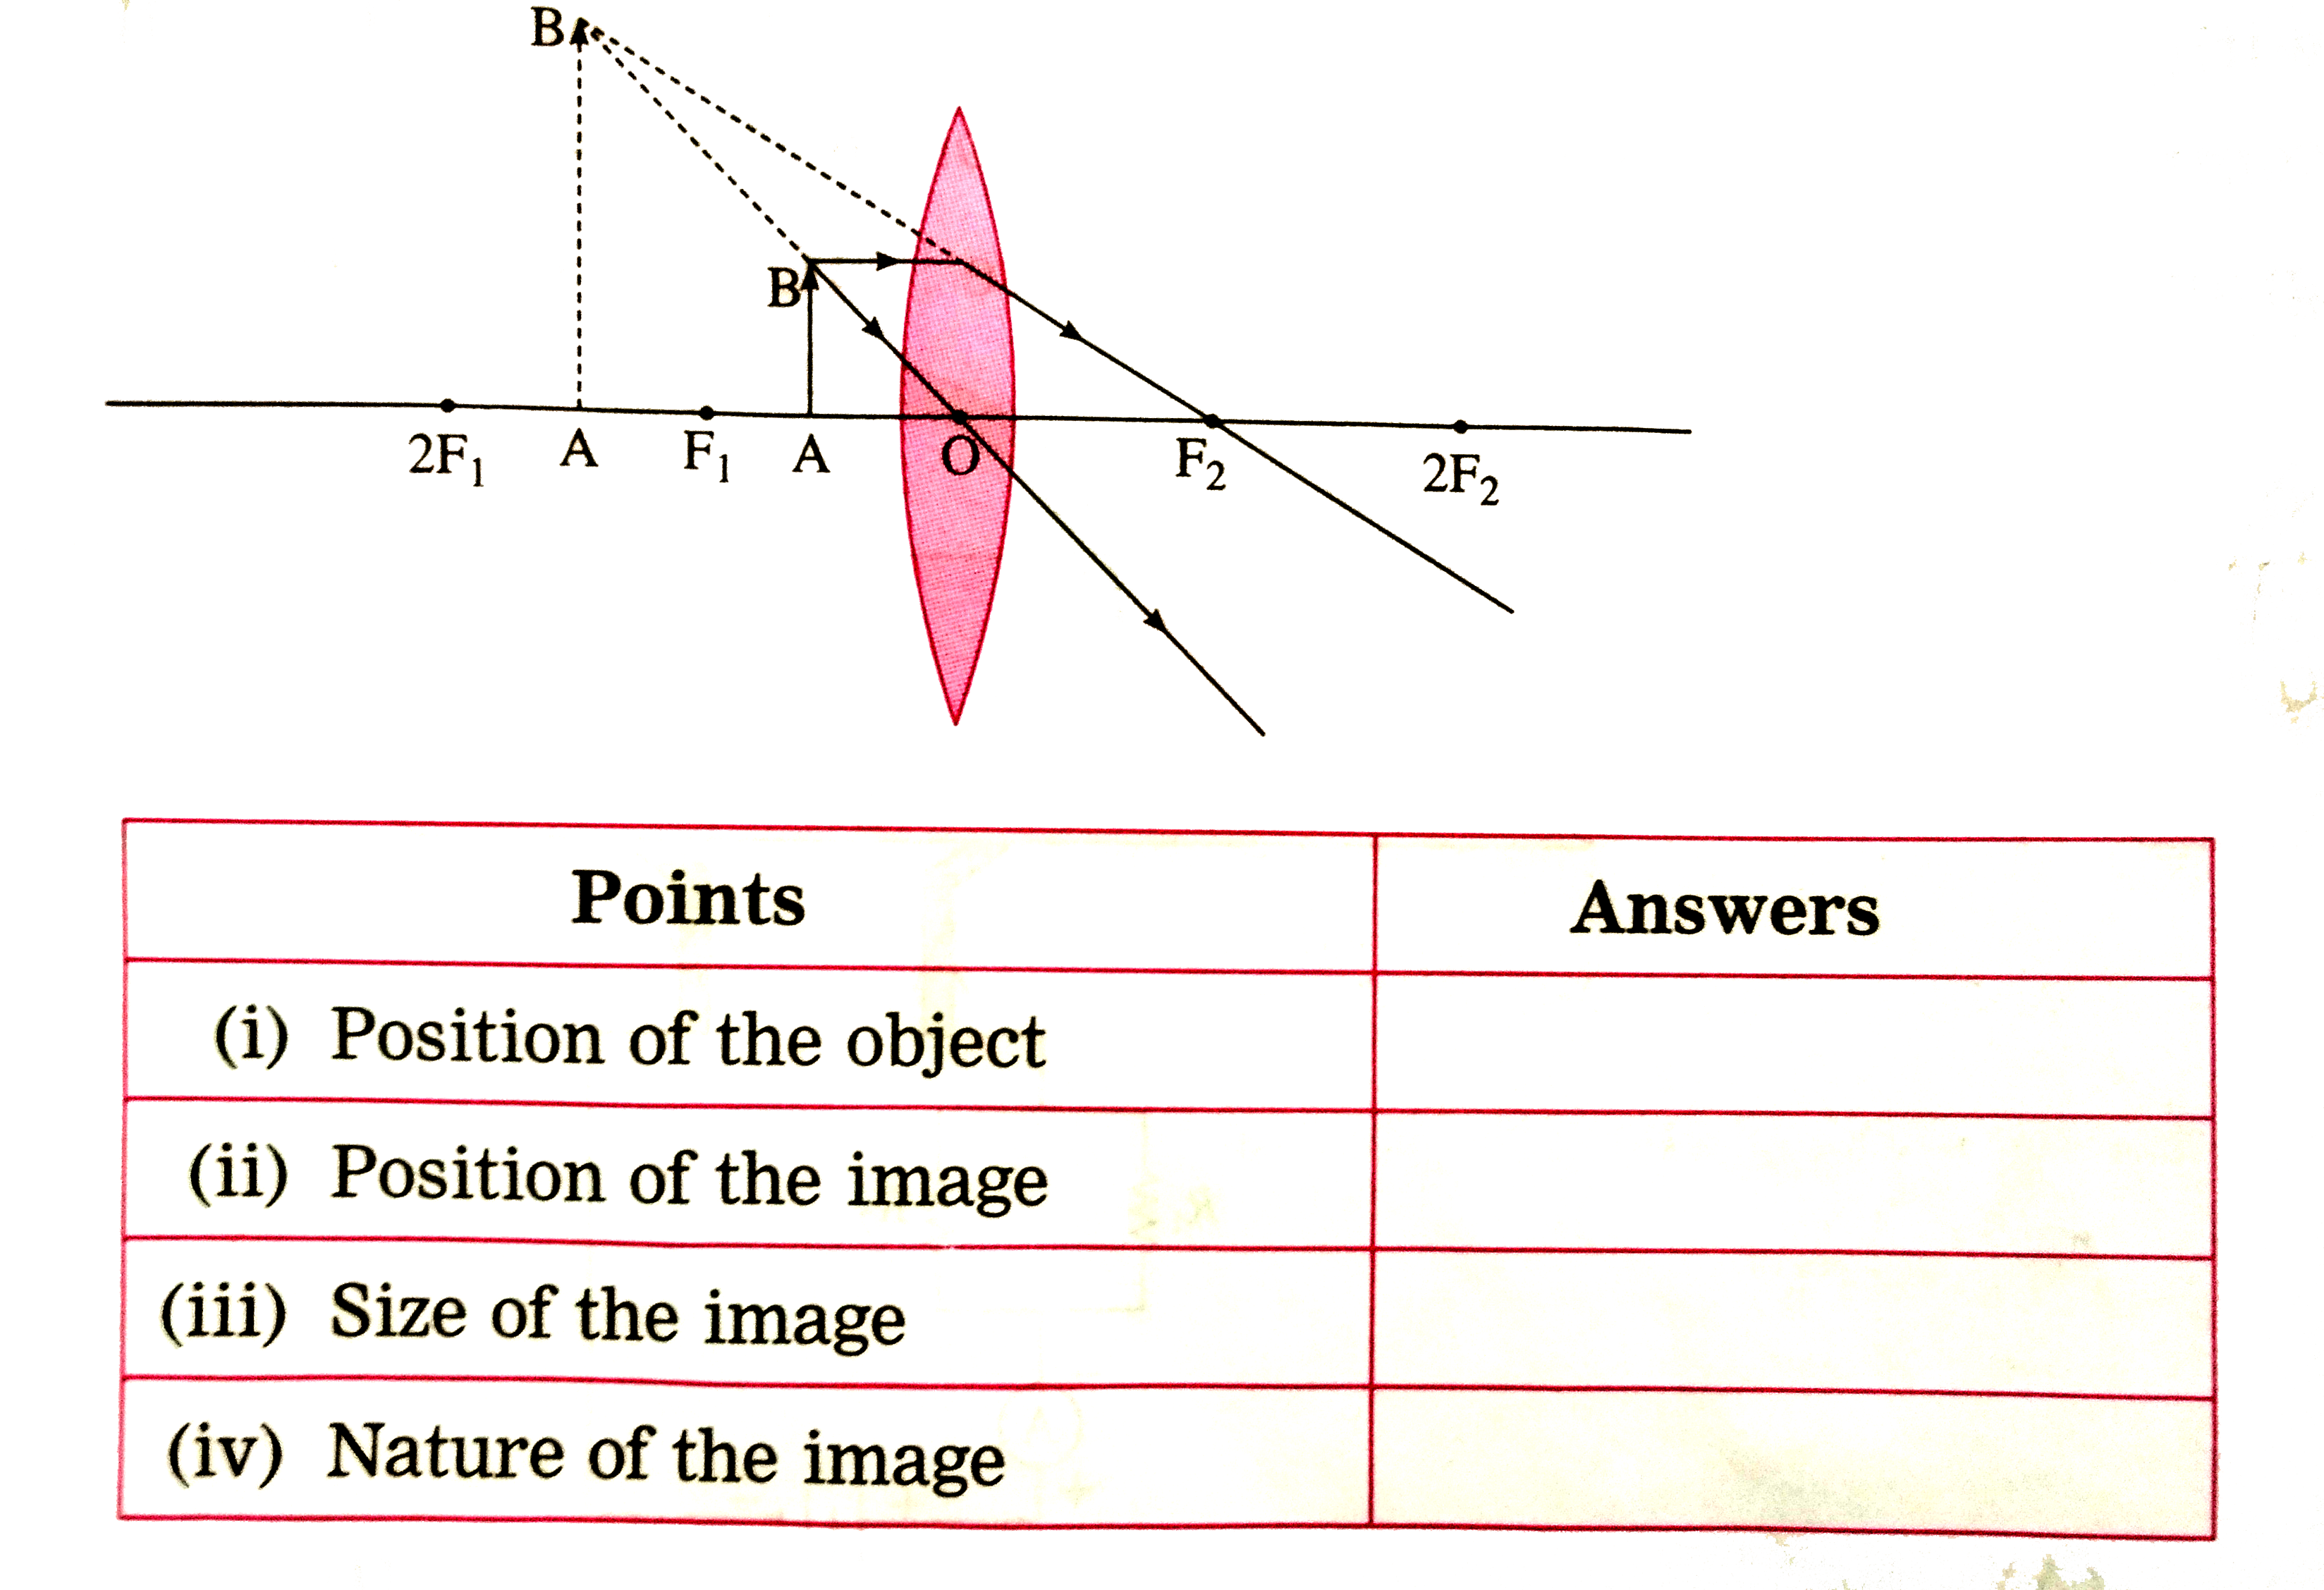
Observe the following figure and complete the table:
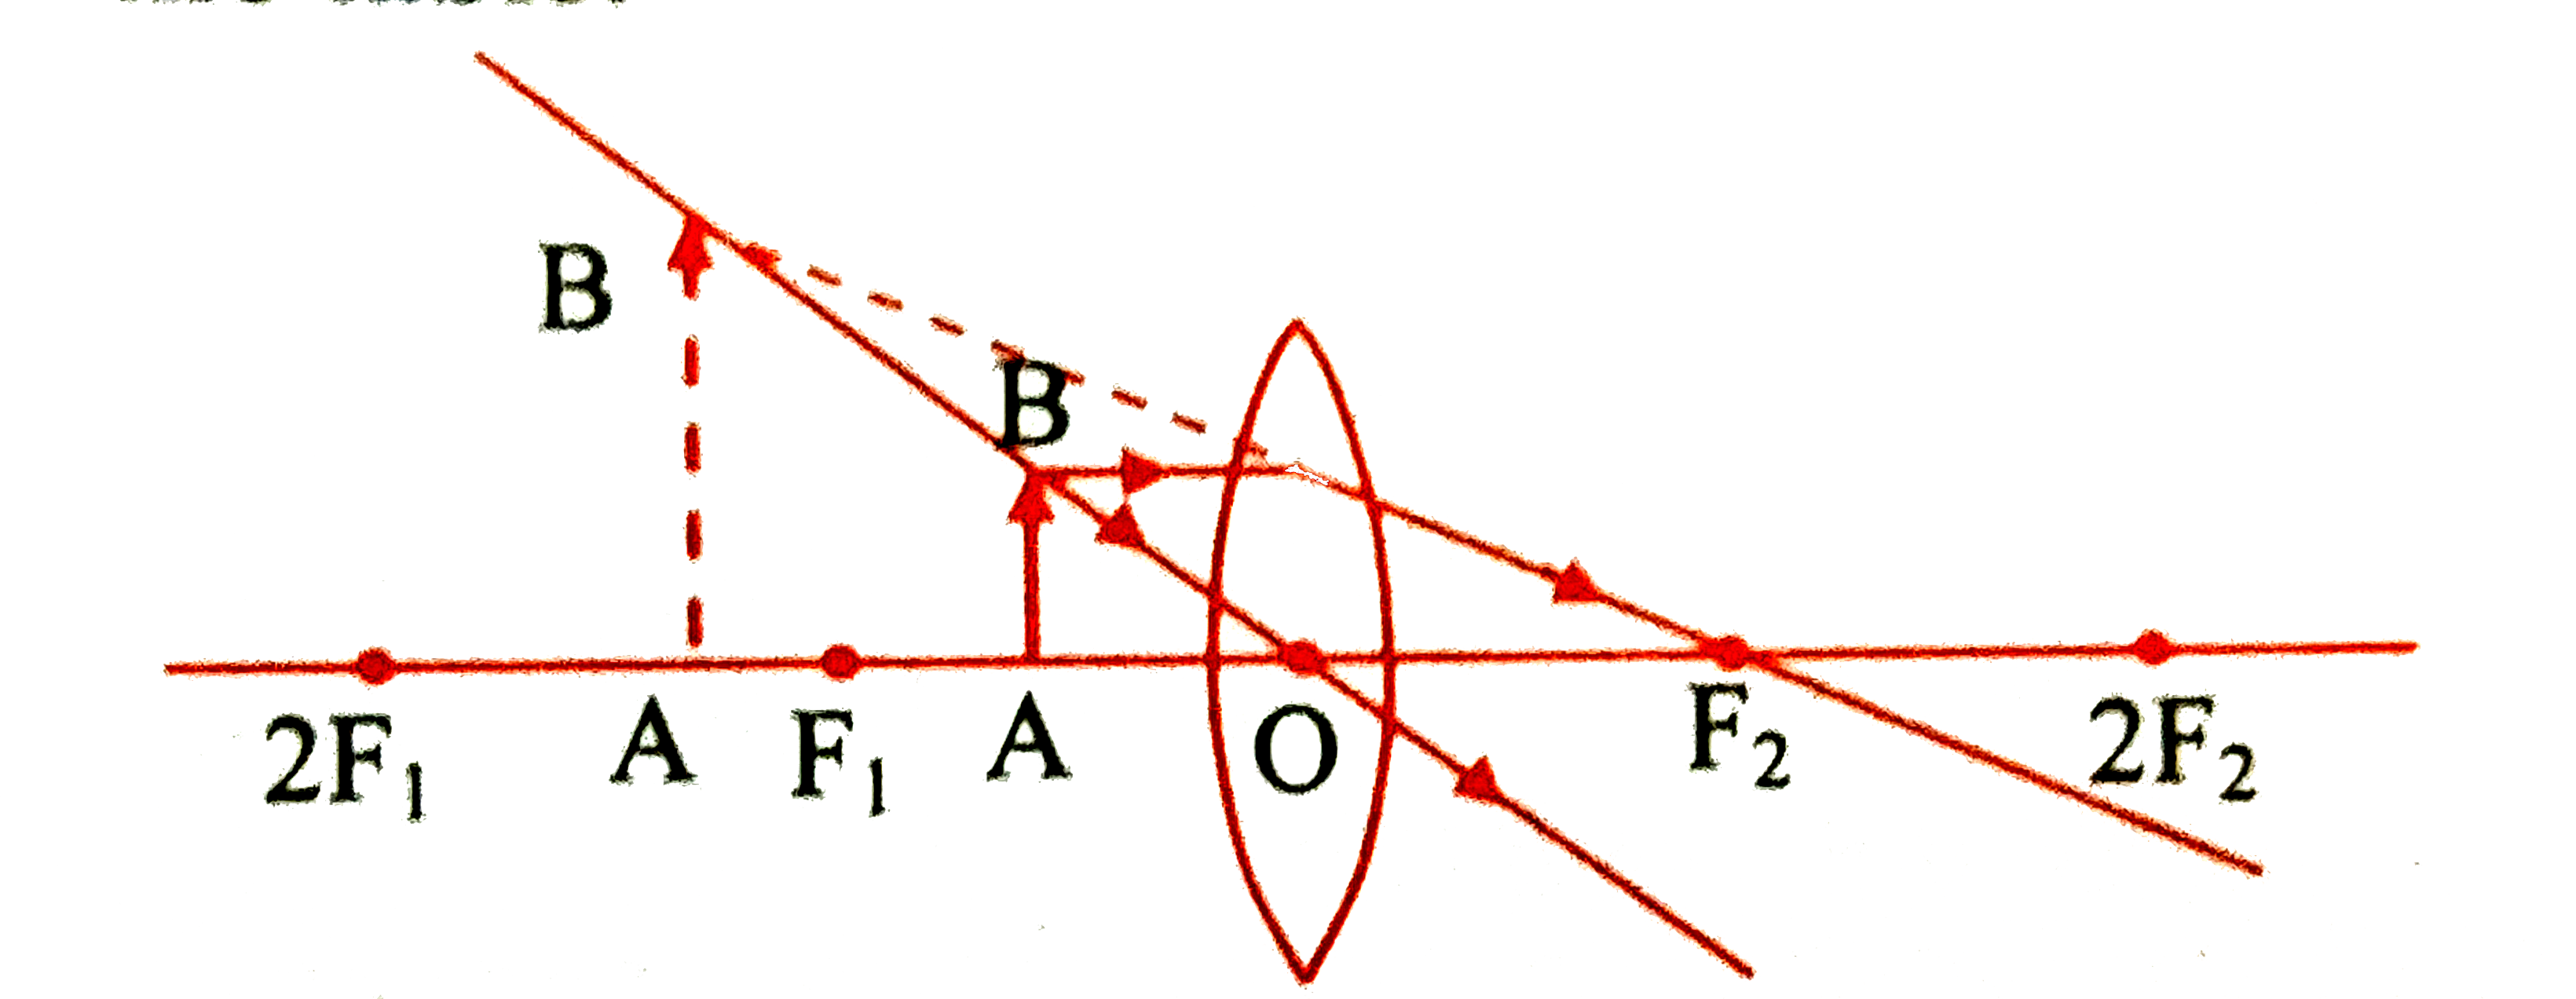
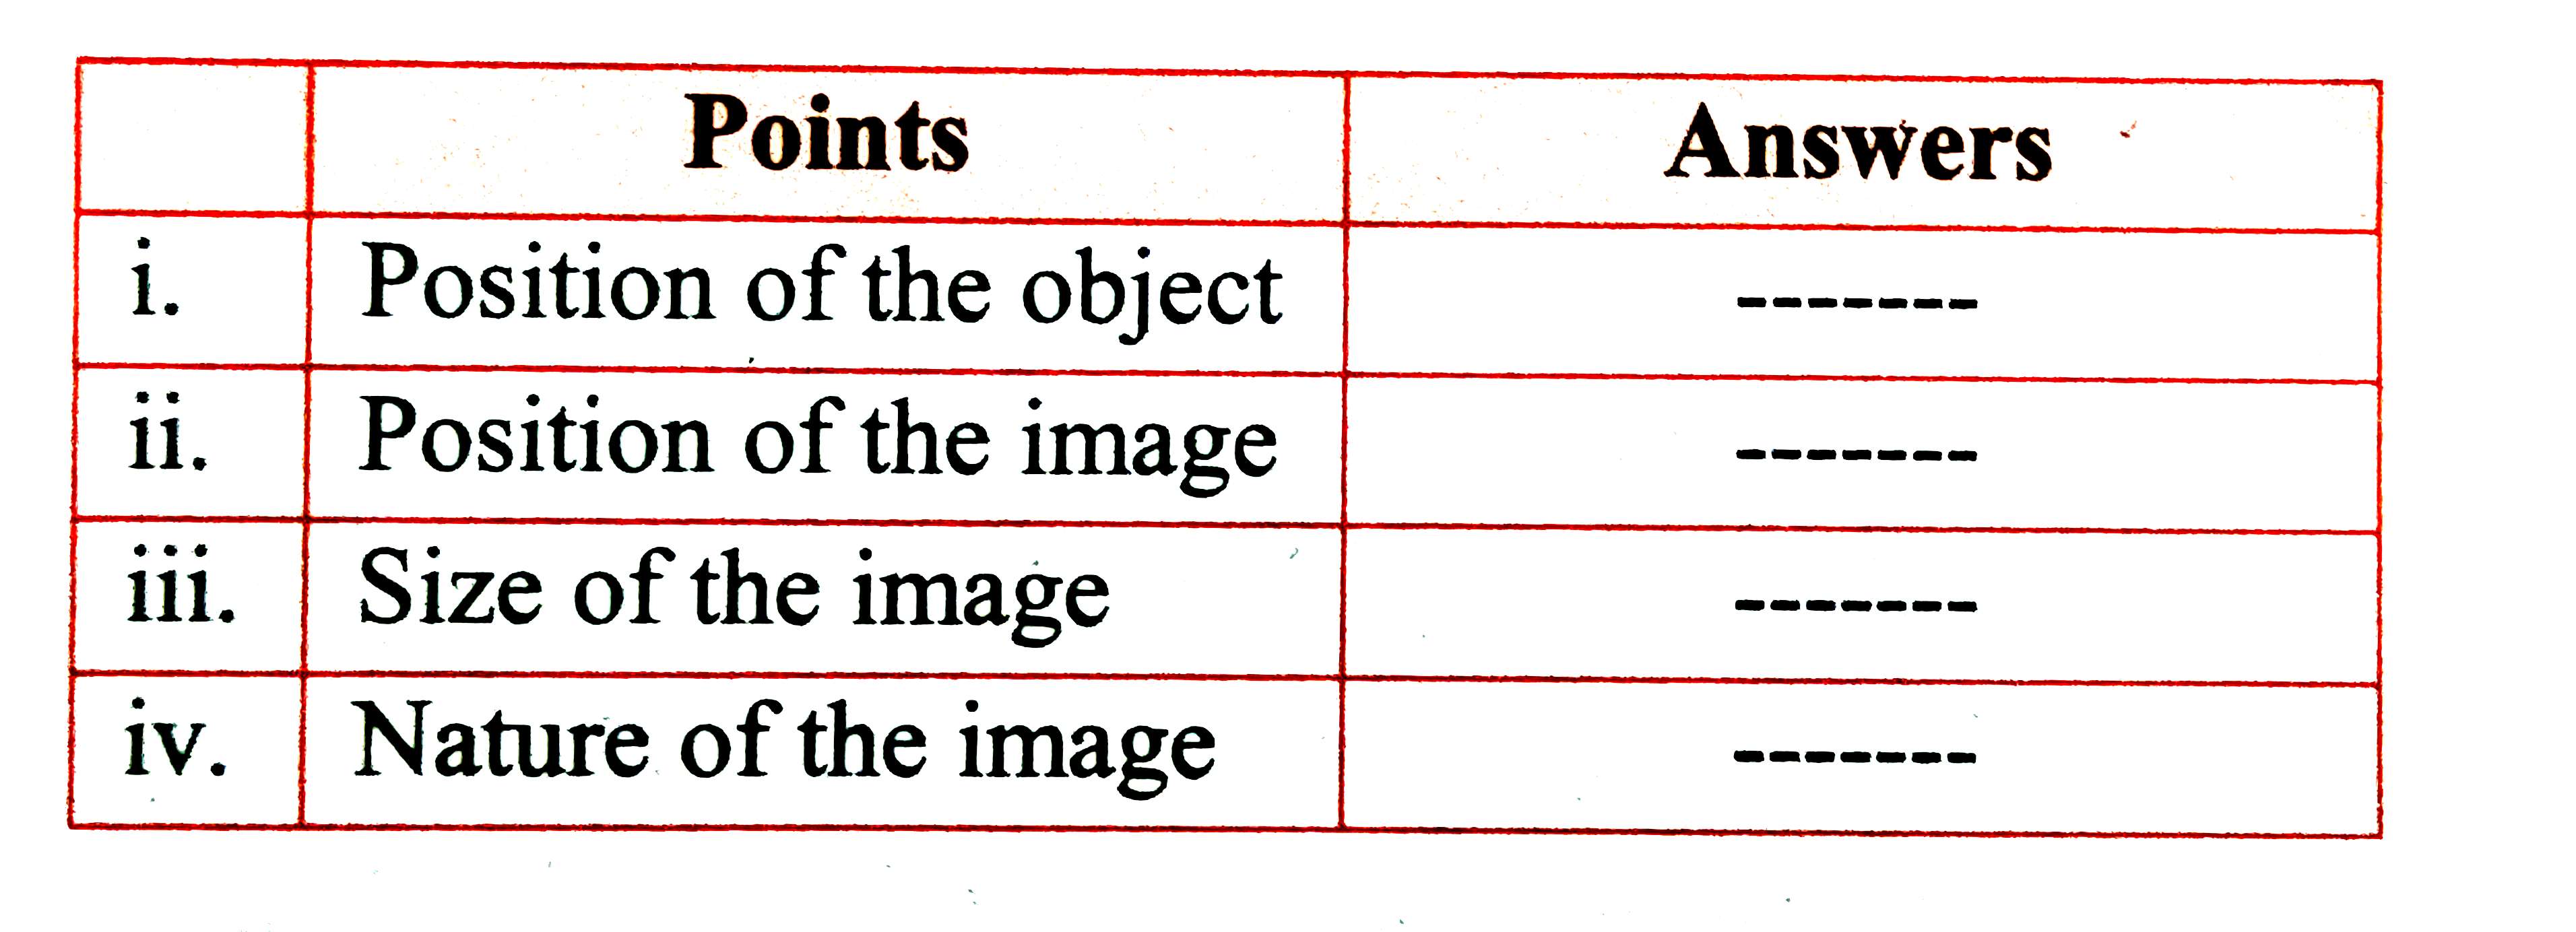
View SolutionObserve the following figure and complete the table :
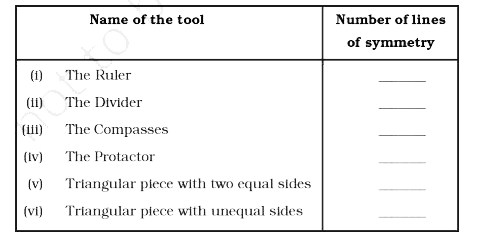
View SolutionOpen your geometry box. There are some drawing tools. Observe them and complete the following table:
View SolutionObserve the following frequency distribution table. It shows the distances travelled by 60 public transport buses in a day. Find the median of the distance travelled.

View SolutionA student focused the image of a candle flame on a white screen by placing the flame at various distance from a convex lens. He noted his observation as mentioned in the following table.
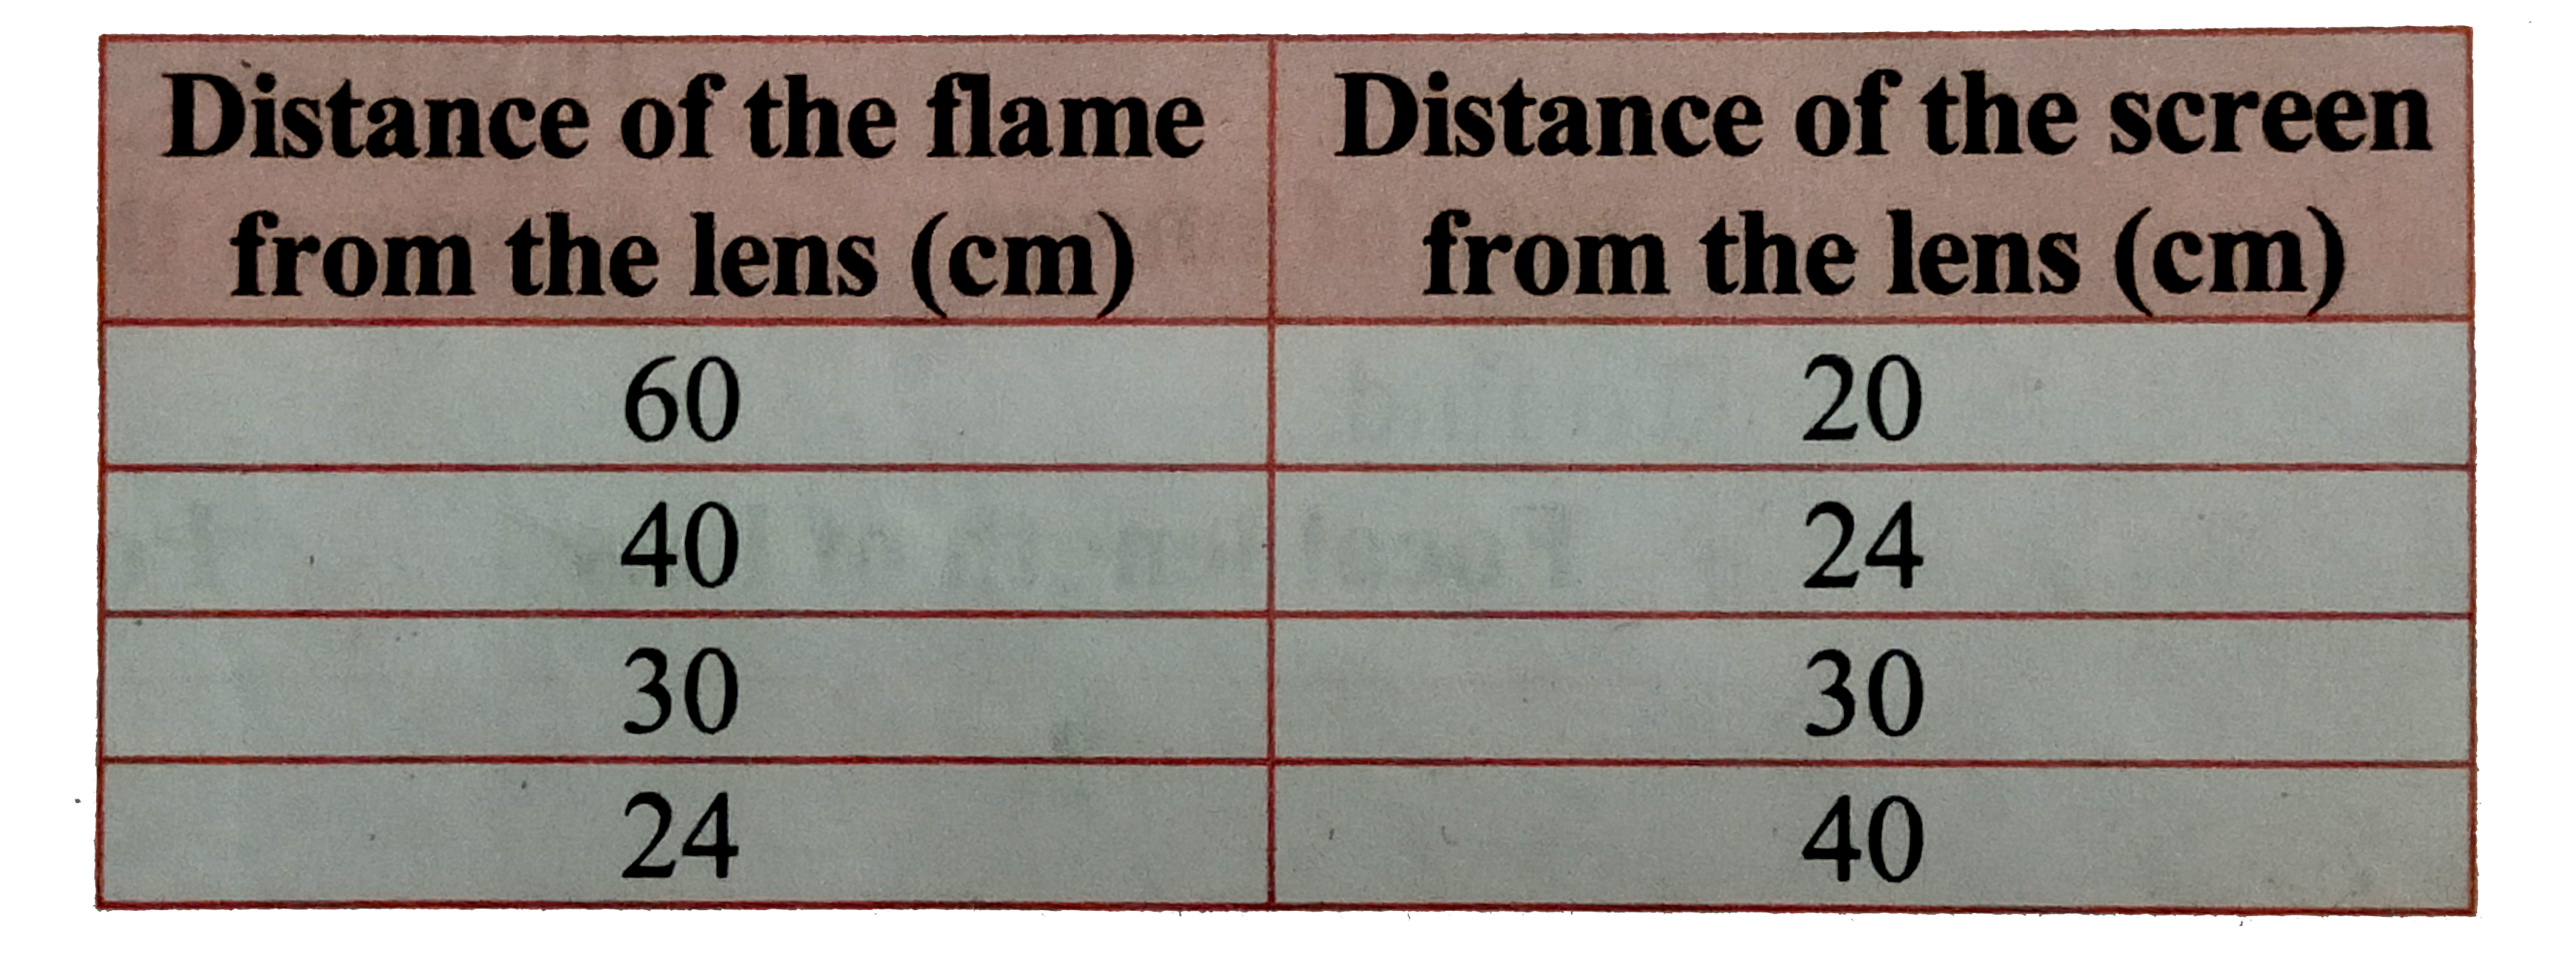
Analyze the above table and answer the following questions.
Draw a ray diagram to show the image fonnation for any set of observation.
View SolutionThe total number of observations in the following distribution table is 120 and their mean is 50. Find the value of missing frequencies f1andf2 :

View SolutionThe total number of observations in the following distribution table is 120 and their mean is 50. Find the value of missing frequencies f1andf2 :

View Solution

