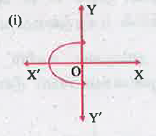
கீழே கொடுக்கப்பட்ட வரைபடங்கள் சார்பைக் குறிக்கின்றனவா எனத் தீர்மானிக்கவும் விடைகளுக்கான காரணத்தையும் கொடுக்கவும்.

Step by step video & image solution for கீழே கொடுக்கப்பட்ட வரைபடங்கள் சார்பைக் குறிக்கின்றனவா எனத் தீர்மானிக்கவும் விடைகளுக்கான காரணத்தையும் கொடுக்கவும். by Maths experts to help you in doubts & scoring excellent marks in Class 10 exams.
Updated on:21/07/2023Topper's Solved these Questions
Similar Questions
கீழ்க்காணும் மூன்று மாறிலிகளில் அமைந்த ஒருங்கமை நேரியல் சமன்பாட்டுத் தொகுப்புகளைத் தீர்க்க. x + y + z = 5, 2x - y + z = 9, x - 2y + 3z = 16
View Solution3 ஆல் வகுக்கும் போது மீதி 2 -ஐத் தரக்கூடிய அனைத்து மிகைமுழுக்களையும் காண்க.
View SolutionIdentify the cell organelle 'A' :-
ltimg src="https://d10lpgp6xz60nq.cloudfront.net/physics_images/ALN_BIO_C10_E08_018_Q01.png" width="80%"gt
View SolutionHow many lines of symmetry does the above figure have ?
View SolutionWhich of the following are correct chain isomers of butane ? (i)
View SolutionDetermine the point of symmetry of a regular hexagon.
View SolutionDtermine the images of the following figure about the given line :
View SolutionMatch the following Column A to Column B

View SolutionMatch the following Column A to Column B

View SolutionMatch the following Column A to Column B

View SolutionFind the area of the figure given below.

View SolutionThe area of the shaded part in the figure given below is ______.

View SolutionThe inequation represented by the graph given below is :
View SolutionThe inequation that best describes the graph given below is _________
View SolutionThe inequation that best describes the following graph is _________
View SolutionWhich inequations represent the shaded region in the given figure
View Solution
