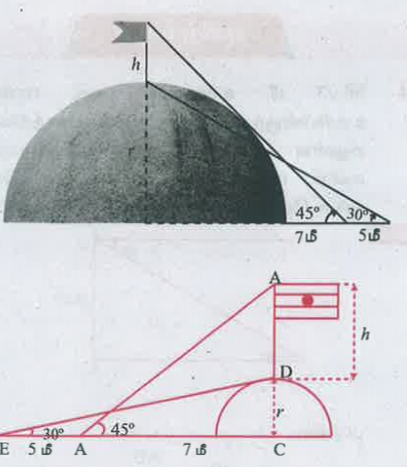
r' மீஆரம் கொண்ட அரைக்கோளக் குவிமாடத்தின் மீது 'h' மீ உயரமுள்ள ஒரு கொடிக்கம்பம் நிற்கிறது. குவிமாடத்தின் அடியிலிருந்து 7மீ தொலைவில் ஒருவர் நிற்கிறார். அவர்கொடிக்கம்பத்தின் உச்சியை 45∘ ஏற்றக் கோணத்திலும் நிற்குமிடத்திலிருந்து மேலும் 5மீ தொலை விலகிச் சென்று கொடிக்கம்பத்தின் அடியை 30∘ஏற்றக்கோணத்திலும் பார்க்கிறார் எனில், கொடிக்கம்பத்தின்உயரம் காண்க.

Step by step video & image solution for r' மீஆரம் கொண்ட அரைக்கோளக் குவிமாடத்தின் மீது 'h' மீ உயரமுள்ள ஒரு கொடிக்கம்பம் நிற்கிறது. குவிமாடத்தின் அடியிலிருந்து 7மீ தொலைவில் ஒருவர் நிற்கிறார். அவர்கொடிக்கம்பத்தின் உச்சியை 45^@ ஏற்றக் கோணத்திலும் நிற்குமிடத்திலிருந்து மேலும் 5மீ தொலை விலகிச் சென்று கொடிக்கம்பத்தின் அடியை 30^@ஏற்றக்கோணத்திலும் பார்க்கிறார் எனில், கொடிக்கம்பத்தின்உயரம் காண்க. by Maths experts to help you in doubts & scoring excellent marks in Class 10 exams.
Updated on:21/07/2023Topper's Solved these Questions
Similar Questions
கீழ்க்காணும் தரவுகளுக்கு வீச்சு மற்றும் வீச்சுக் கெழுவைக் காண்க ? 63,89,98,125,79,108,117,68
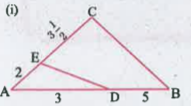
View Solutionகீழே கொடுக்கப்பட்டவற்றில் எந்த முக்கோணங்கள் வடிவொத்தவை என்பதைச் சோதிக்கவும் ?

View SolutionIdentify the cell organelle 'A' :-
ltimg src="https://d10lpgp6xz60nq.cloudfront.net/physics_images/ALN_BIO_C10_E08_018_Q01.png" width="80%"gt
View SolutionHow many lines of symmetry does the above figure have ?
View SolutionWhich of the following are correct chain isomers of butane ? (i)
View SolutionDetermine the point of symmetry of a regular hexagon.
View SolutionDtermine the images of the following figure about the given line :
View SolutionMatch the following Column A to Column B

View SolutionMatch the following Column A to Column B

View SolutionMatch the following Column A to Column B

View SolutionFind the area of the figure given below.

View SolutionThe area of the shaded part in the figure given below is ______.

View SolutionThe inequation represented by the graph given below is :
View SolutionThe inequation that best describes the graph given below is _________
View SolutionThe inequation that best describes the following graph is _________
View SolutionWhich inequations represent the shaded region in the given figure
View Solution
