Given below are marks (out of 100) of 10 students in an examination . Calculate first and third quartiles.
90,64,79,33,85,59,60,70,40,95
Arranged in assending order of magnitude , the items are

Q1=N+14th item =10+14 th item =114 th item =2.75 th item
Value of 2nd item=40
m Value of 3rd item=59
Difference =59-40=19
Q1=40+(0.75×19)=40+14.25=54.25 marks
Q3=3(N+1)4th item=3(10+1)4 th item =334 th item=8.25 th item.
Value of 8th item=85
Value of 9th item=90
Difference =90-85=5
Q3=85+(.25×5)=85+1.25=86.25 marks
Topper's Solved these Questions
- QUARTILESBOOK - SK AGGARWALACHAPTER - QUARTILESEXERCISE - MULTIPLE CHOICE QUESTIONS
2 Videos
- QUARTILESBOOK - SK AGGARWALACHAPTER - QUARTILESEXERCISE - NUMERICAL QUESTIONS
7 Videos
- QUARTILESBOOK - SK AGGARWALACHAPTER - QUARTILESEXERCISE - NUMERICAL QUESTIONS
7 Videos
- PRODUCTION FUNCTION : RETURNS TO A FACTORBOOK - SK AGGARWALACHAPTER - PRODUCTION FUNCTION : RETURNS TO A FACTOREXERCISE - SOME IMPORTANT QUESTIONS
11 Videos
- REVENUE BOOK - SK AGGARWALACHAPTER - REVENUE EXERCISE - SOME IMPORTANT QUESTIONS
14 Videos
Similar Questions
Given below are marks ( out of 100) of 10 students in an examination. Calculate median marks.
90,64,79,33,85,59,60,70,40,95
View SolutionGiven below are the marks ( out of maximum of 100) of 10 students in an examination. Calculate the simple arithmetic mean of the marks.
90,64,79,33,85,59,60,70,40,95
View Solution
Knowledge Check
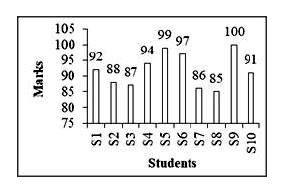
The Bar graph given below presents the marks (out of 100) obtained by 10 students in a subject.

What is the average of the marks obtained by all the students?AA)91.9BB)90.9CC)89.9DD)82.9
The marks obtained (out of 100) by a class of 80 students are given below

View SolutionFind out range and quartile deviation from the following marks obtained by 10 students .
90 , 64 , 79 , 33, 85 , 59 , 60 , 70 , 40 , 95
View SolutionThe marks obtained (out of 100) by 12 students in an examination are
74, 96, 87, 65, 99, 82, 76, 92, 66, 75, 85, 90
Find the median marks.
View SolutionGiven below are the marks obtained by 40 students in an examination :
40 56 24 41 51 22 59 12 26 46
51 14 23 59 58 29 41 35 36 40
42 43 36 33 38 52 23 24 13 55
18 54 20 57 30 24 43 50 26 15
Taking class intervals 10−20,20−30,.....,50−60, construct a frequency table for the above distribution.
View SolutionCalculate average deviation from the data of marks obtained by 10 students .
90 , 64 , 79 , 33 , 85 , 59 , 60 , 70 , 40, 95
View SolutionGiven the marks of ten students , calculate standard deviation and coefficient of variation :
70 , 80 , 90 , 85 , 65 , 55 , 75 , 84 , 97 , 59
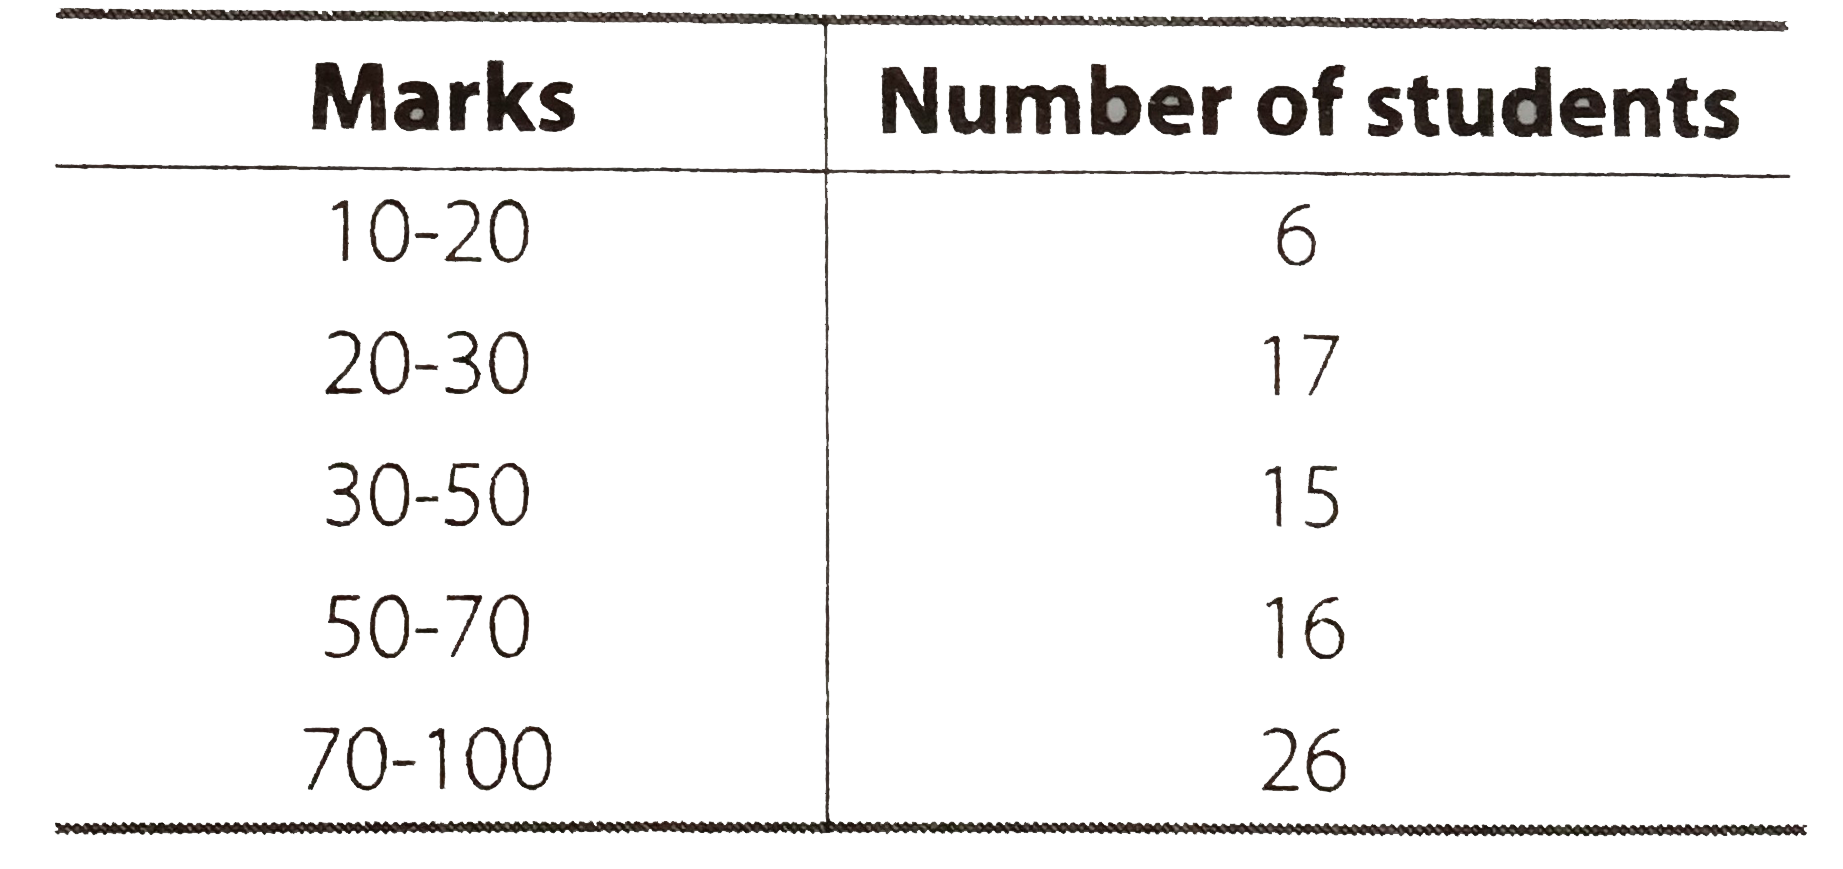
View SolutionThe following table gives the marks scored by 100 students in an entrance examination.

View Solution
