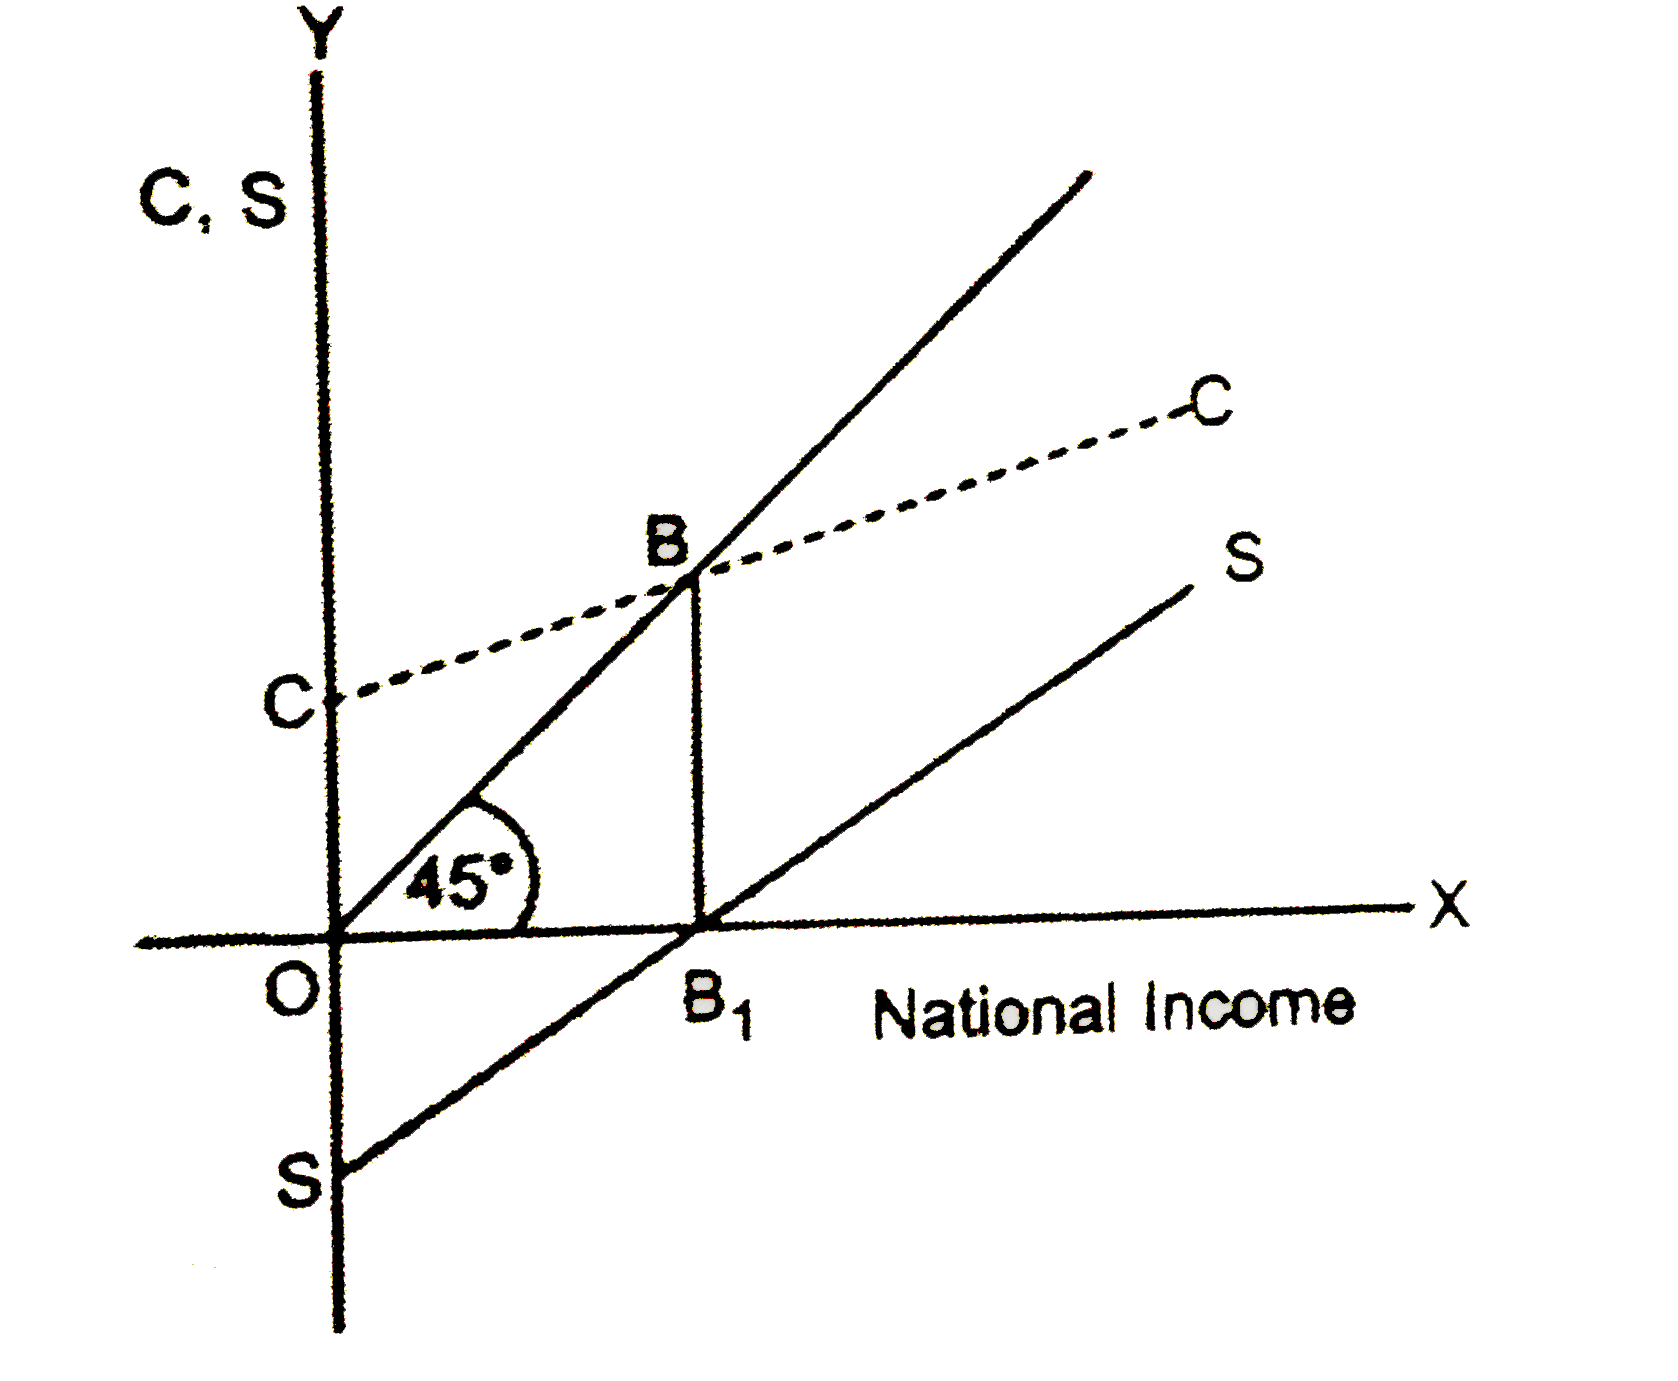
Draw consumption curve and saving curve in a single diagram and mark the 'break -even point'
Text Solution

B1 is a break -even point on S curve
B is break -even point on C curve
|
Topper's Solved these Questions
- BALANCE OF PAYMENTSBOOK - SK AGGARWALACHAPTER - BALANCE OF PAYMENTSEXERCISE - Unit 4
9 Videos
- BALANCE OF PAYMENTSBOOK - SK AGGARWALACHAPTER - BALANCE OF PAYMENTSEXERCISE - Unit 5
11 Videos
- BALANCE OF PAYMENTSBOOK - SK AGGARWALACHAPTER - BALANCE OF PAYMENTSEXERCISE - Unit 2
7 Videos
- AGRICULTURE :1950-1990BOOK - SK AGGARWALACHAPTER - AGRICULTURE :1950-1990EXERCISE - Multiple Choice Questions
5 Videos
- DETERMINATION OF INCOME AND EMPLOYMENTBOOK - SK AGGARWALACHAPTER - DETERMINATION OF INCOME AND EMPLOYMENTEXERCISE - CBSE Examination Questions
2 Videos
Similar Questions
Knowledge Check
The consumption function curve is :
AUpward slopingBDownward slopingCParallel to the X-axisDParallel to the Y-axisThe break-even point is where
Amarginal revenue equals marginal costBaverage revenue equals average costCtotal revenue equals total costDNone of theseThe 'break-even' point is where
Amarginal revenue equals marginal costBaverage revenue equals average costCtotal revenue equals total costDNone of the above
Draw ATC and AVC curves on a single diagram.
View SolutionDraw ATC,AVC and MC curves on a single diagram.
View SolutionDraw TFC,TVC andTC curves on a single diagram.
View SolutionDraw TVC, TC, and TFC curves in a single diagram.
View SolutionOutline the steps required to be taken in deriving saving curve from the given consumption curve. Use diagram. ltBrgt OR
Given consumption curve, derive saving curve and state the steps taken in the process of derivation. Use diagram.
View Solution
