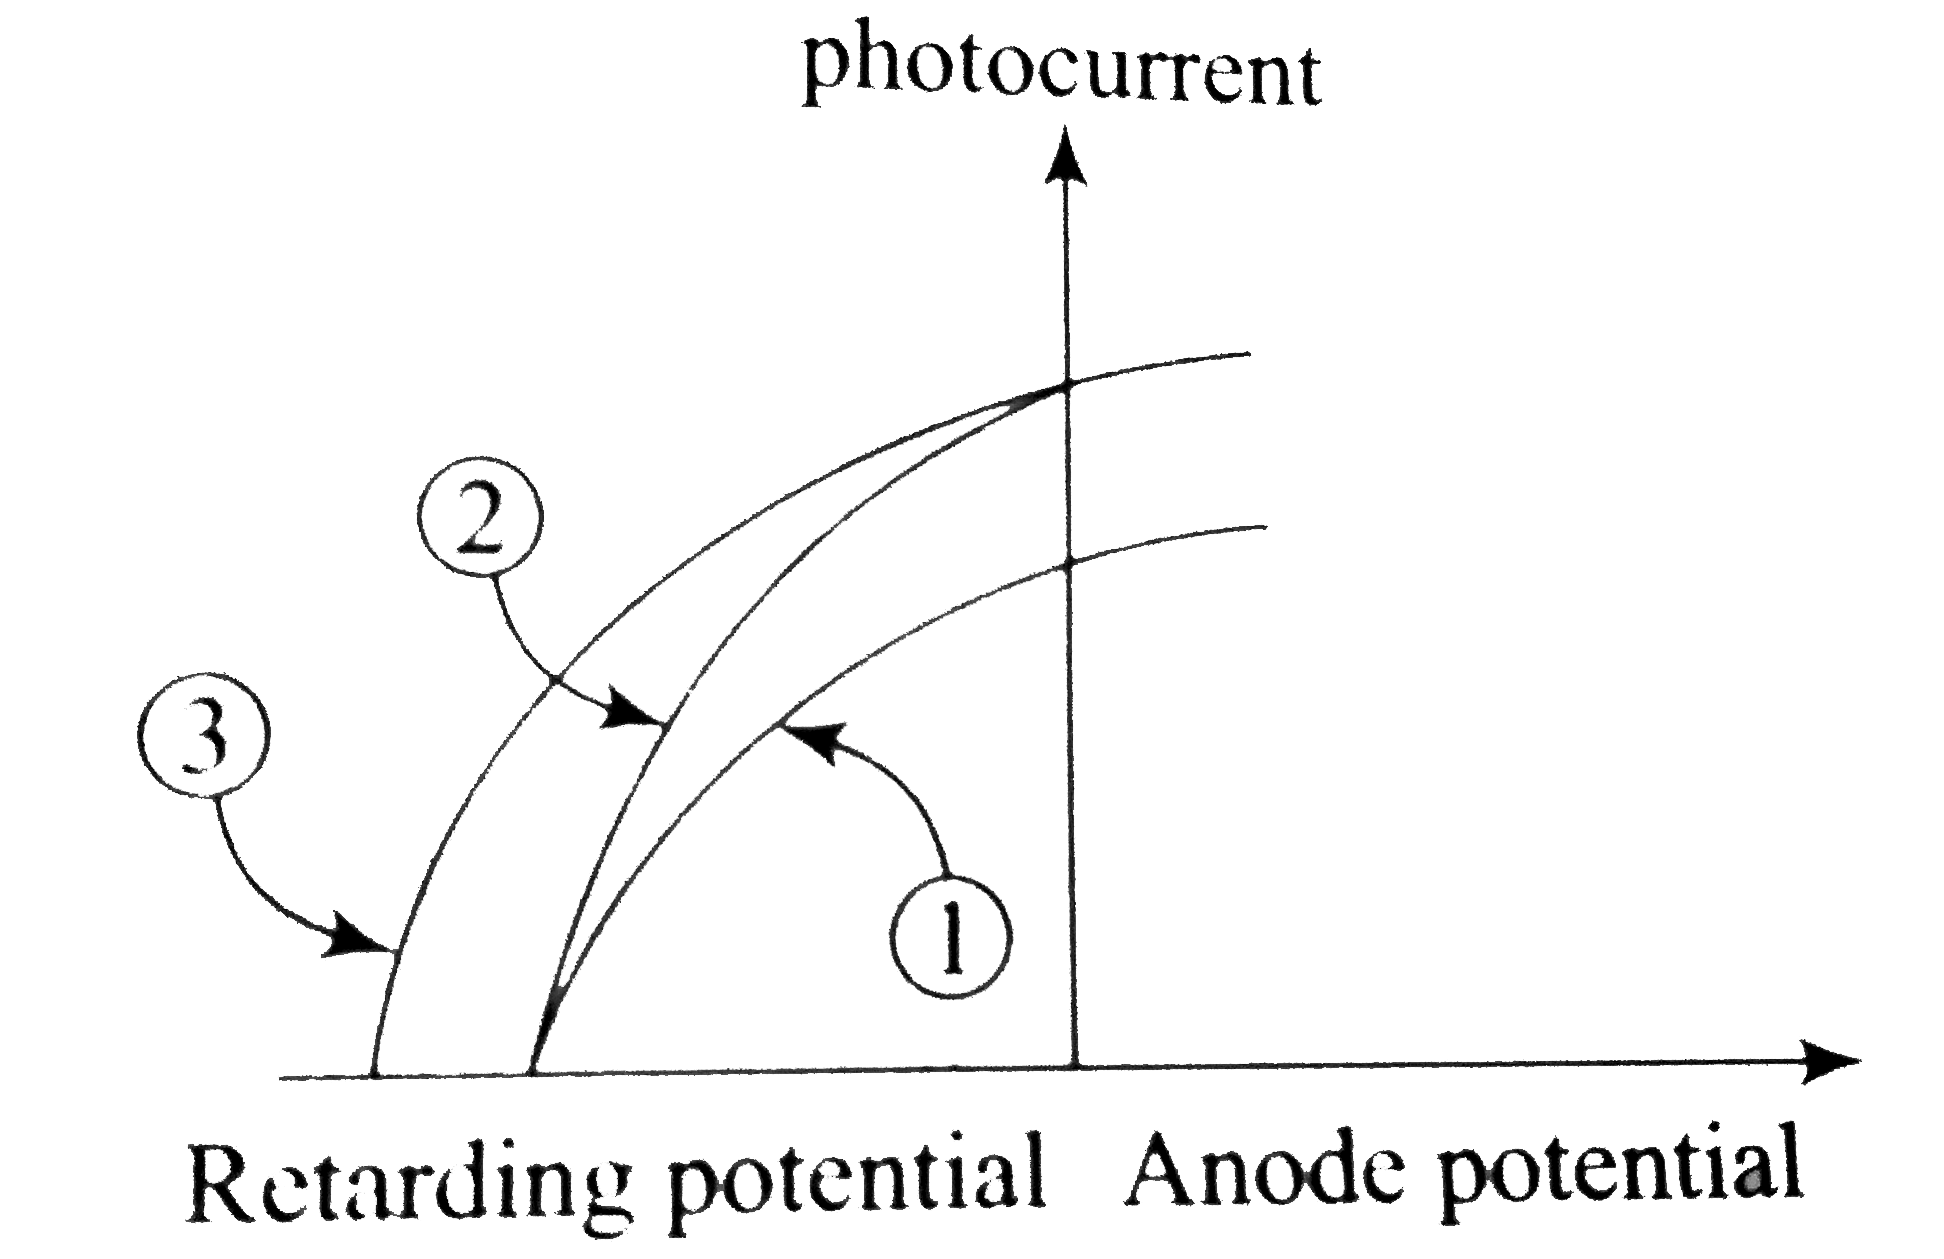
The figure shows a plot of photo current versus anode potential for a photo sensitive surface for the different radiations. Which one of the following is a correct statement? (CBSE 2009)

curves (1) and (2) represent incident radiatons of different frequencies and different intensities.
curves (1) and (2) represent incident radiations of same frequency but of different intensities.
curves (2) and (3) represent incident radiations of different frequency and different frequencies and differentd intensities.
curves (2) and (3) represent incident radiations same frequency having same intensity
The correct Answer is:2
Stopping potential depends on frequency and correct depends on Intensions.
Topper's Solved these Questions
- DUAL NATURE OF RADIATION AND MATTERBOOK - NARAYNACHAPTER - DUAL NATURE OF RADIATION AND MATTEREXERCISE - EXERCISE - 4
25 Videos
- DUAL NATURE OF RADIATION AND MATTERBOOK - NARAYNACHAPTER - DUAL NATURE OF RADIATION AND MATTEREXERCISE - ASSERTION AND REASON
15 Videos
- DUAL NATURE OF RADIATION AND MATTERBOOK - NARAYNACHAPTER - DUAL NATURE OF RADIATION AND MATTEREXERCISE - EXERCISE - 2 (H.W)
20 Videos
- CURRENT ELECTRICITYBOOK - NARAYNACHAPTER - CURRENT ELECTRICITYEXERCISE - Level 6
43 Videos
- DUAL NATUREBOOK - NARAYNACHAPTER - DUAL NATUREEXERCISE - LEVEL-II (H.W)
17 Videos
Similar Questions
The figure shows a plot of photo current versus anode potential for a photosensitive surface for three different radiations. Which one of the following is a correct statement ?
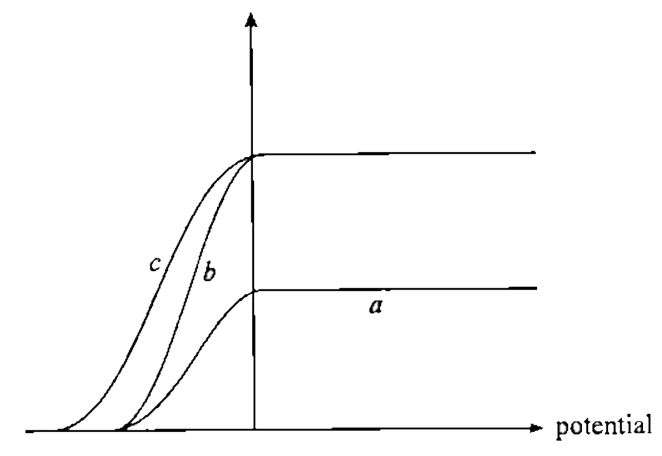
View SolutionIn photoelectric experiment the plot between anode potential and photoelectric current is shown in figure 2.3.1. Which of the following is correct:
View Solution
Knowledge Check
The figure shows a plot of photo current versus anode potential for a photosensitive surface for three different radiations. Which one of the following is a correct statement ?
 ACurves a and b represent incident radiations of different frequencies and different intensitiesBCurves a and b represent incident radiations of the same frequency but no different intensitiesCCurves b and c represent incident radiations of different frequencies and different intensitiesDCurve b and c represent incident radiations of the same frequency having the same intensity
The fig. shows the variation of photon current with anode potential for a photo-sensitive surface for three different radiation. Let Ia,IbandIc be the intensities and fa,fbandfc be the frequency for the curves a,b and c respectively.
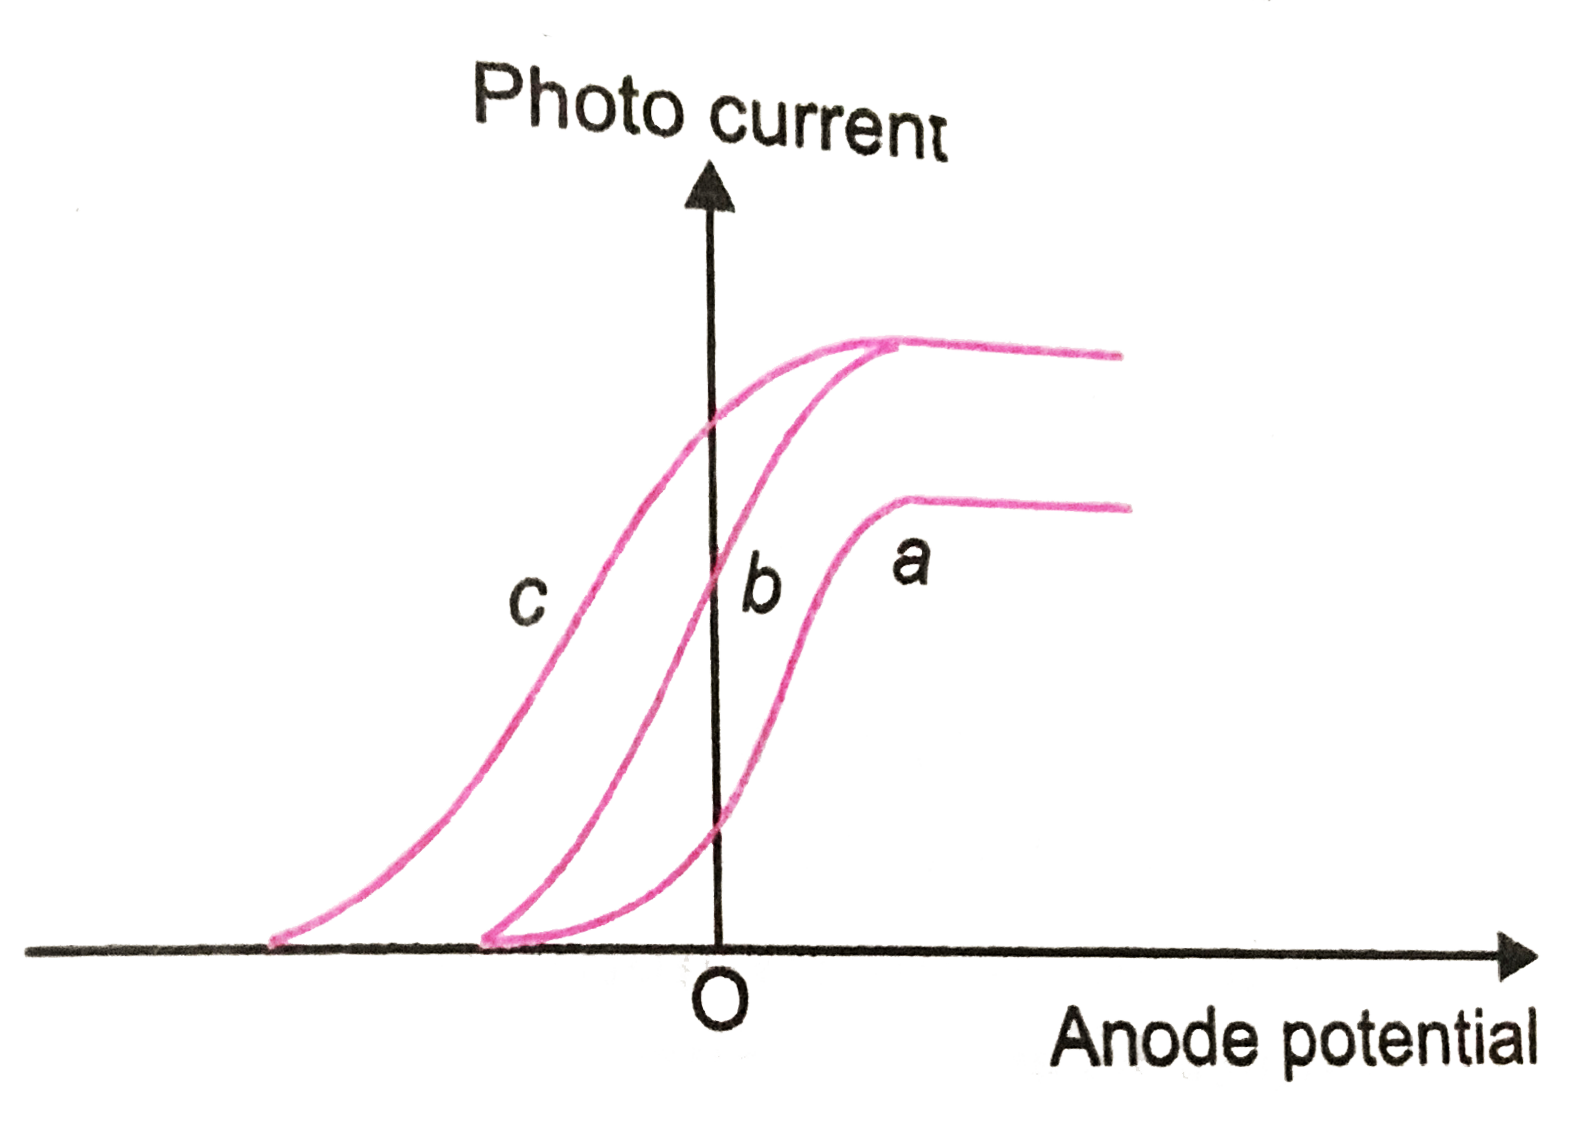 Ava=vbandIa≠IbBva=vcandIa=IcCva=vbandIa=IbDvb=vcandIb=Ic
The fig. shows the variation of photon current with anode potential for a photo-sensitive surface for three different radiation. Let Ia,IbandIc be the intensities and fa,fbandfc be the frequency for the curves a,b and c respectively.
 Afa=fbandIa≠IbBfa=fcandIa=IcCfa=fbandIa=IbDfb=fcandIb=Ic
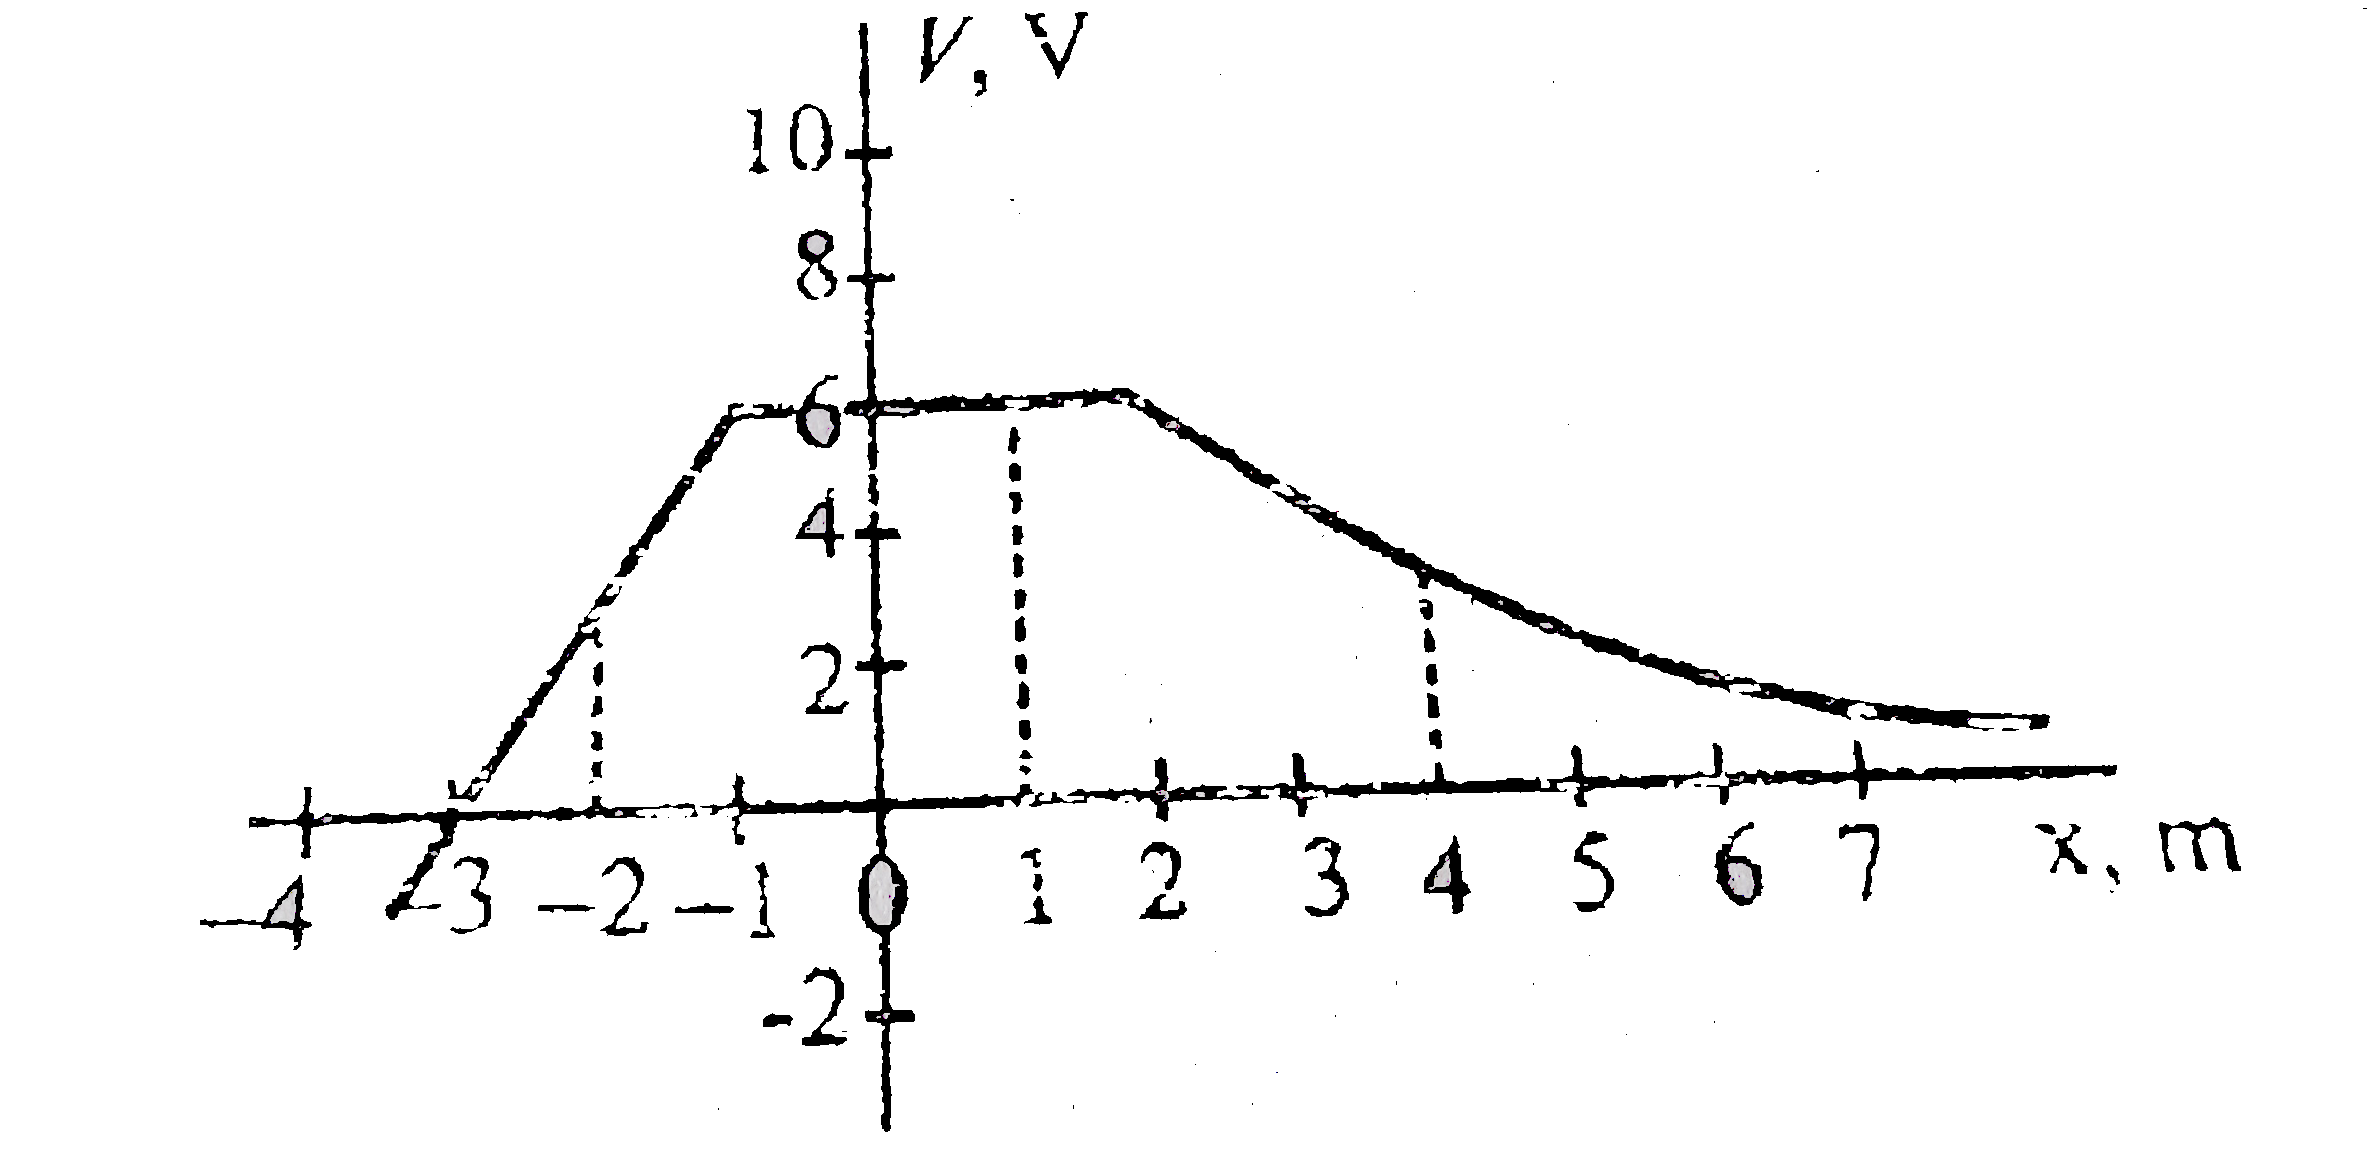
The potential as a function of x is plotted in figure. Which of the following is / are correct?
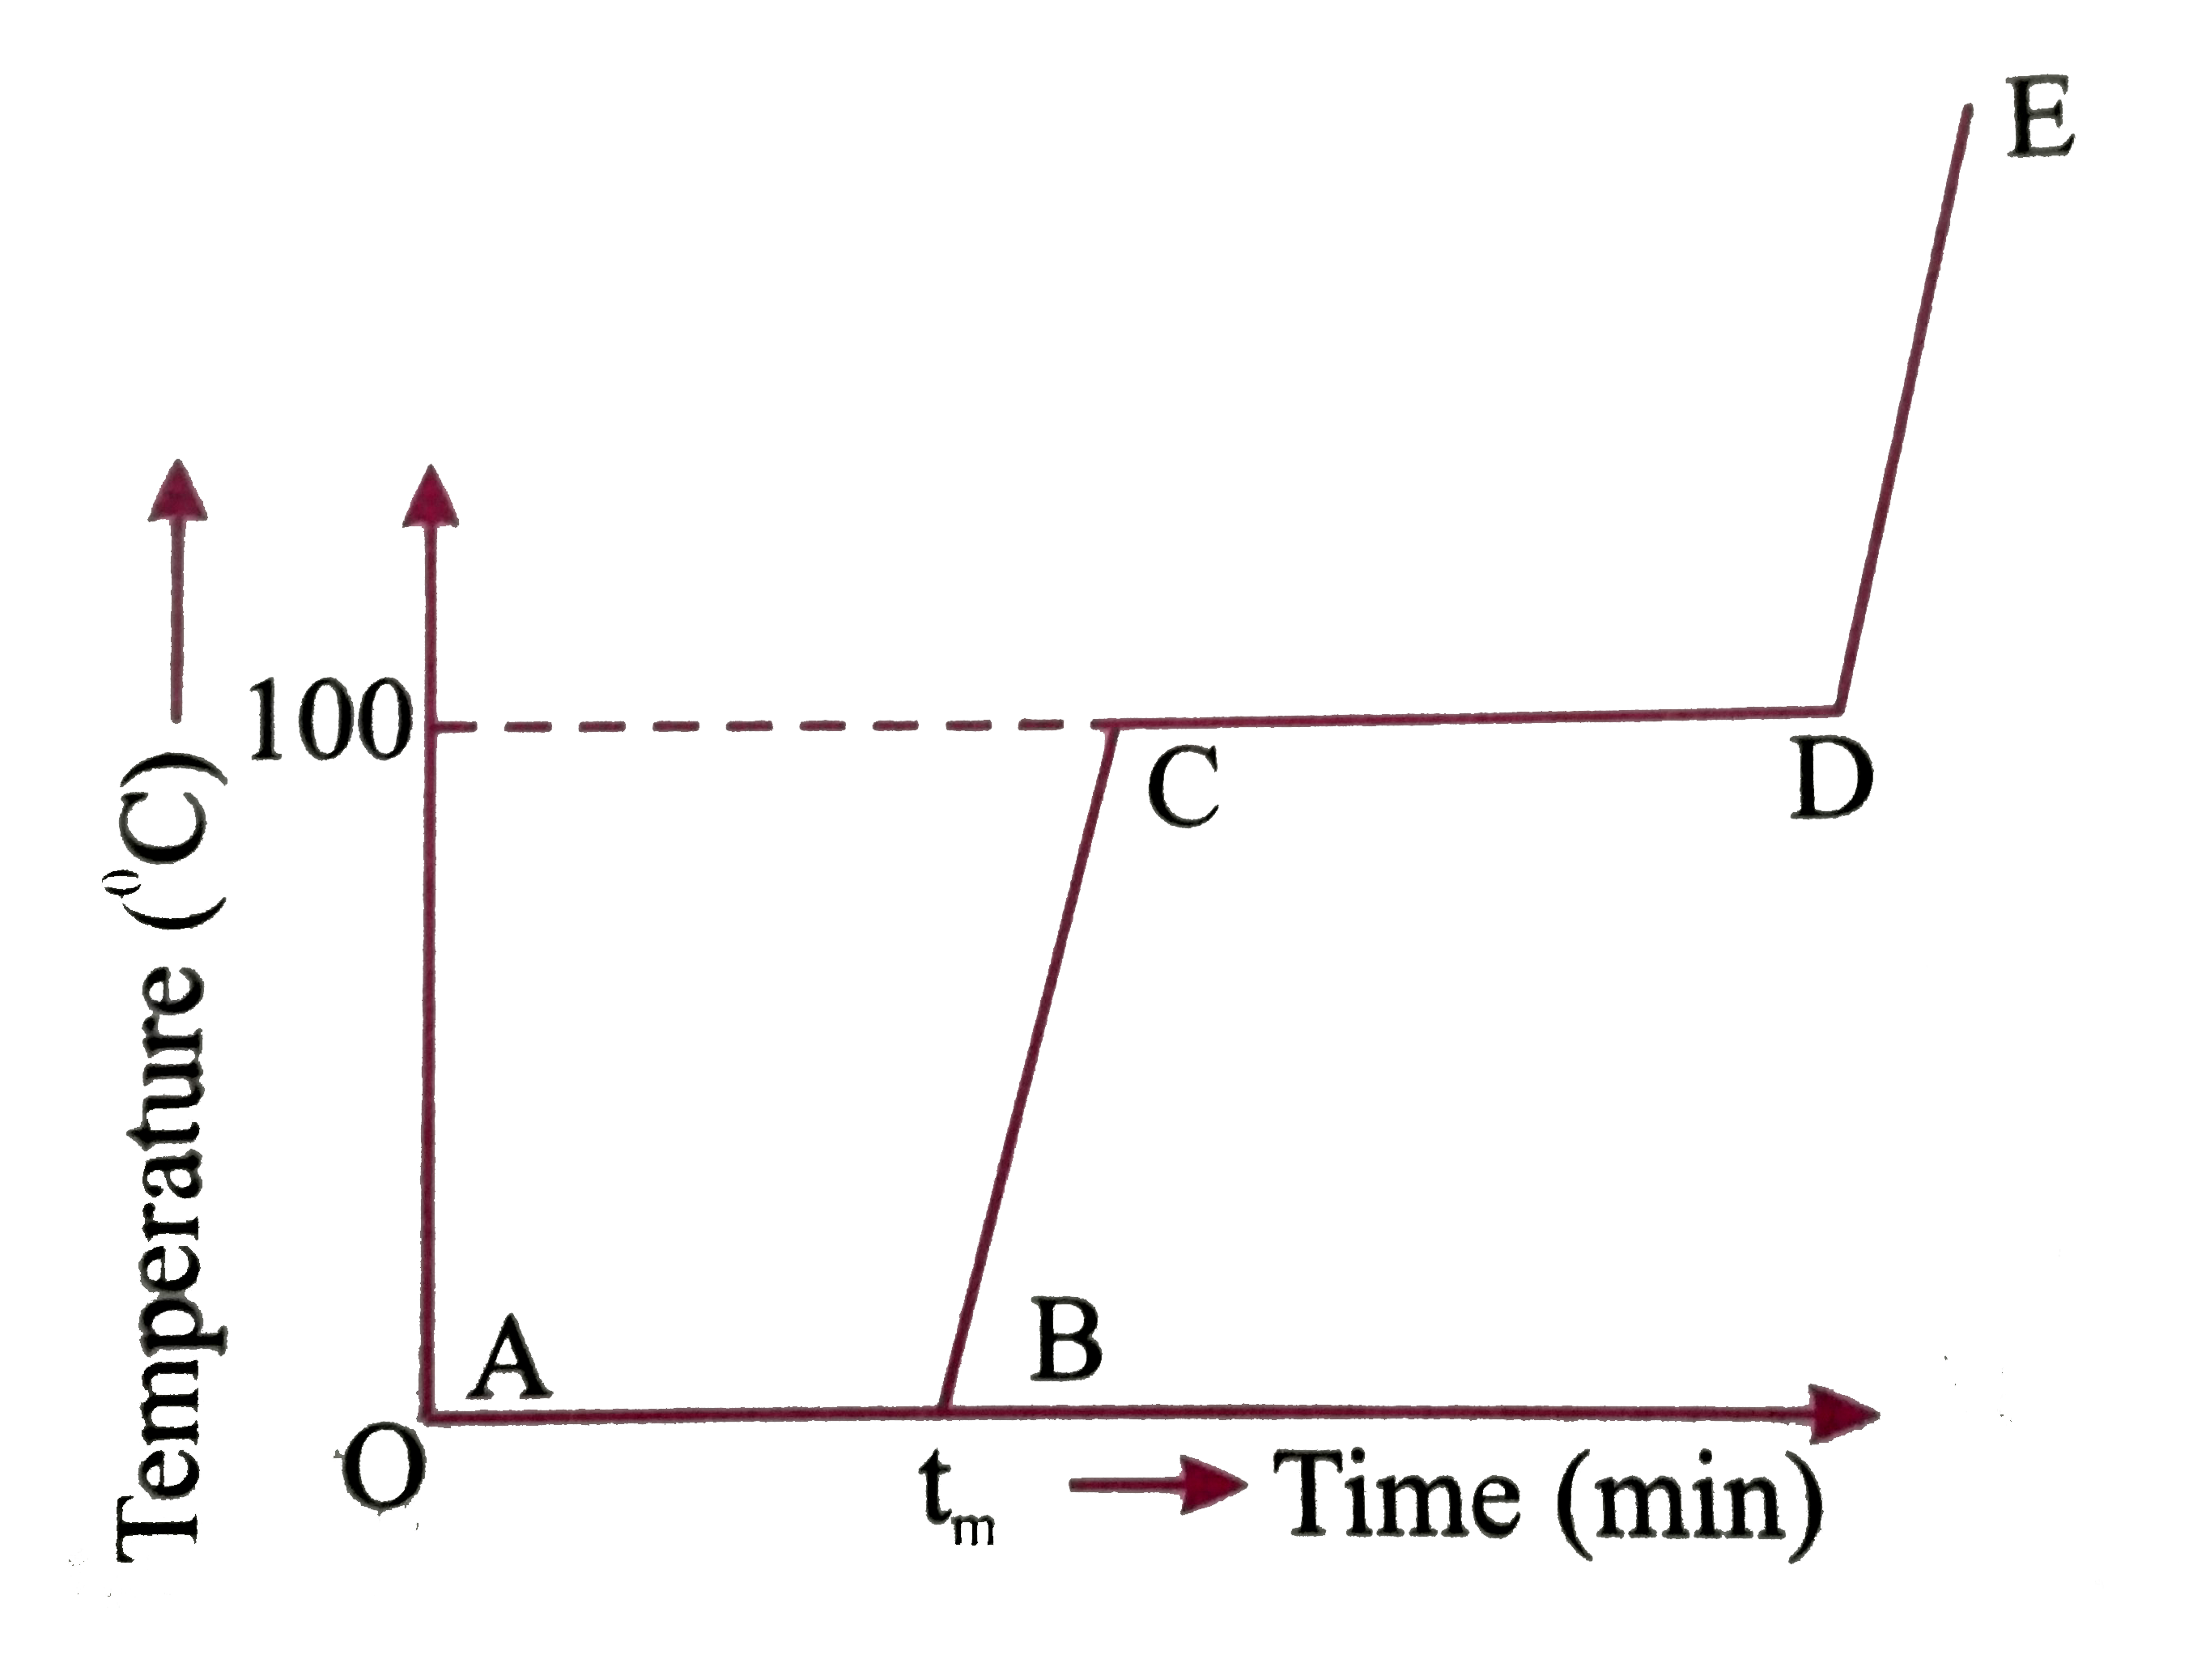
View SolutionRefer to the plot of temperature versus time (figure) showing the changes in the state if ice on heating (not to scale). Which of the following is correct ?
 .
.
View SolutionRefer to the plot of temperature versus time (figure) showing the changes in the state if ice on heating (not to scale). Which of the following is correct ?
 .
.
View SolutionRefer to the plot of temperature versus time showing the changes in the state of ice on heating (not to scale).
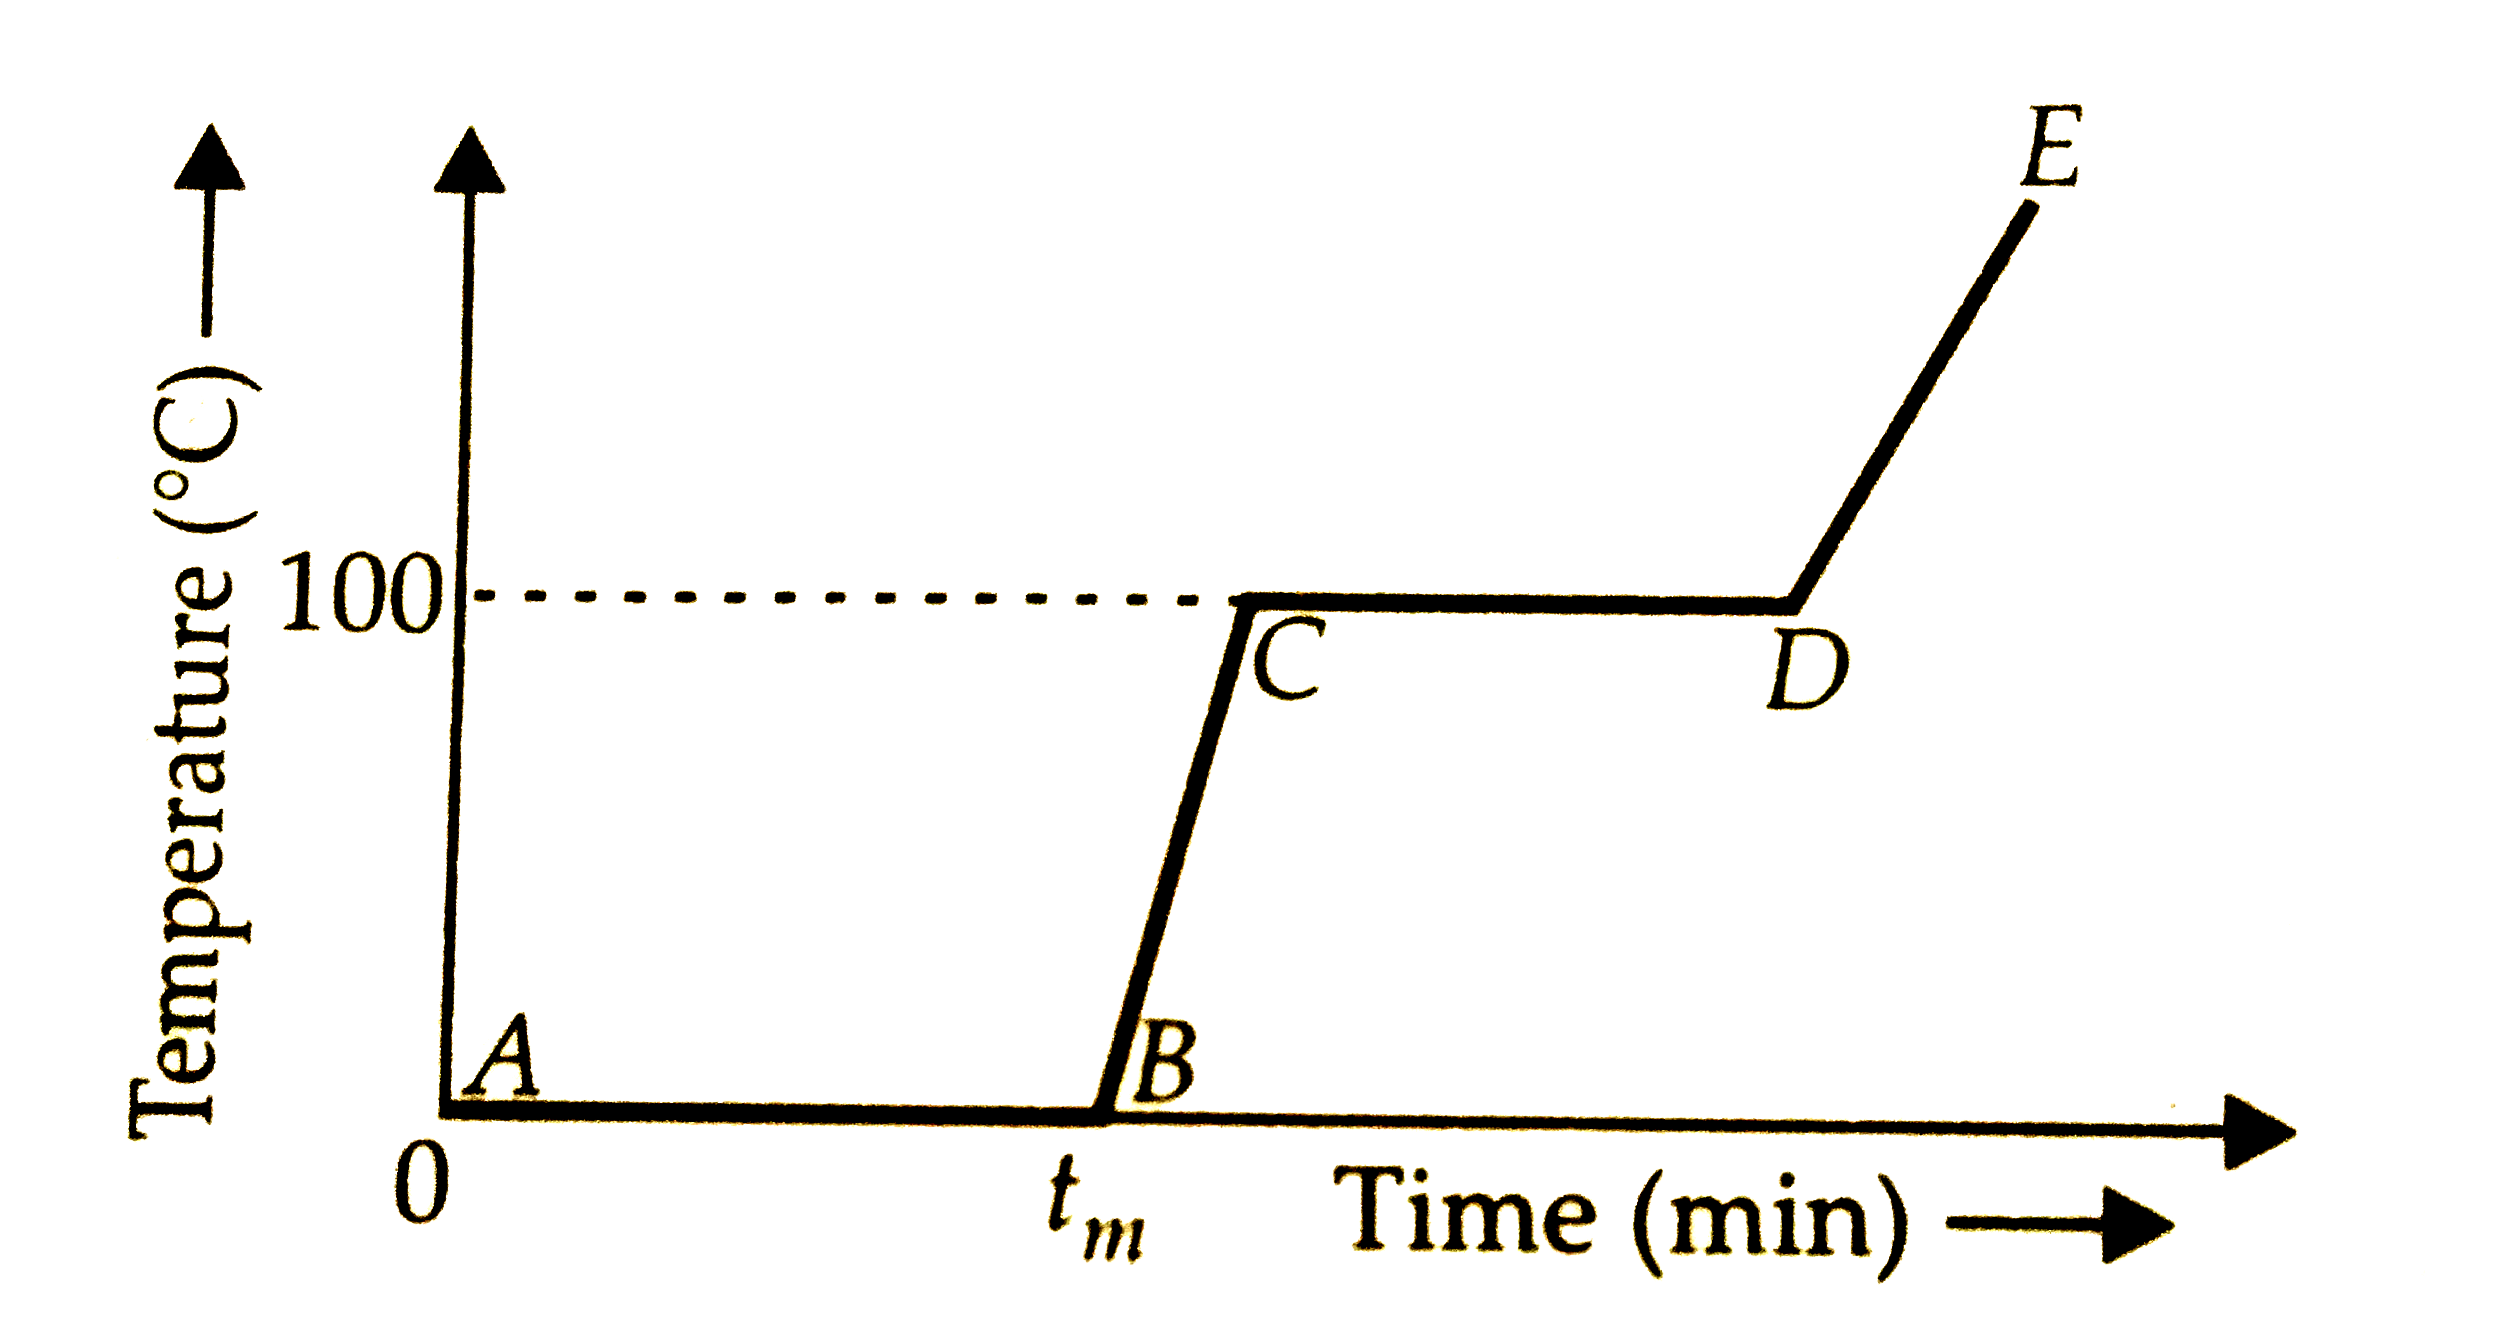
Which of the following is correct ?
View SolutionRefer to the plot of temperature versus time showing the changes in the state of ice on heating (not to scale).

Which of the following is correct ?
View Solution
