Which graph best represents the variation of electric potential as a function of distance from the centre of a uniformly charged solid sphere of charge of radius R ?
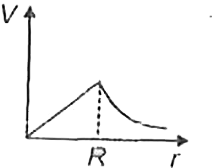
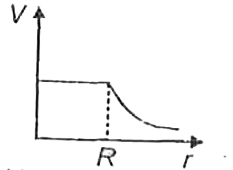
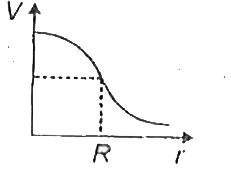
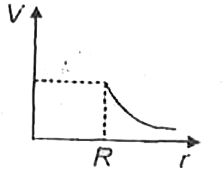
The correct Answer is:3
To determine the variation of electric potential as a function of distance from the center of a uniformly charged solid sphere, we can analyze the behavior of electric potential both inside and outside the sphere.
1. Understanding Electric Potential Inside the Sphere:
- For a uniformly charged solid sphere of radius R and total charge Q, the electric potential V at any point inside the sphere (at a distance r from the center, where r<R) is constant and equal to the potential at the surface of the sphere.
- The formula for the electric potential at the surface is given by:
V=kQR
- Therefore, for r<R:
V=kQR(constant)
2. Understanding Electric Potential Outside the Sphere:
- For points outside the sphere (where r≥R), the electric potential V behaves as if all the charge Q were concentrated at the center of the sphere.
- The formula for the electric potential at a distance r from the center (where r≥R) is:
V=kQr
- This indicates that the potential decreases inversely with distance r.
3. Graphical Representation:
- From the above analysis, we can summarize the behavior of the electric potential:
- Inside the sphere (r<R): The potential is constant at kQR.
- At the surface (r=R): The potential is kQR.
- Outside the sphere (r>R): The potential decreases as 1r.
- Therefore, the graph of electric potential V versus distance r will show:
- A horizontal line at V=kQR for r<R.
- A hyperbolic decline for r≥R, approaching zero as r increases.
4. Choosing the Correct Graph:
- Based on the described behavior, the correct graph will show:
- A constant potential for r<R.
- A decreasing potential for r≥R that approaches zero.
- Thus, the graph that best represents this variation is option 2.
Summary:
- The electric potential is constant inside the sphere and decreases inversely with distance outside the sphere.
- For a uniformly charged solid sphere of radius R and total charge Q, the electric potential V at any point inside the sphere (at a distance r from the center, where r<R) is constant and equal to the potential at the surface of the sphere.
- The formula for the electric potential at the surface is given by:
V=kQR
- Therefore, for r<R:
V=kQR(constant)
- For points outside the sphere (where r≥R), the electric potential V behaves as if all the charge Q were concentrated at the center of the sphere.
- The formula for the electric potential at a distance r from the center (where r≥R) is:
V=kQr
- This indicates that the potential decreases inversely with distance r.
- From the above analysis, we can summarize the behavior of the electric potential:
- Inside the sphere (r<R): The potential is constant at kQR.
- At the surface (r=R): The potential is kQR.
- Outside the sphere (r>R): The potential decreases as 1r.
- Therefore, the graph of electric potential V versus distance r will show:
- A horizontal line at V=kQR for r<R.
- A hyperbolic decline for r≥R, approaching zero as r increases.
- Based on the described behavior, the correct graph will show:
- A constant potential for r<R.
- A decreasing potential for r≥R that approaches zero.
- Thus, the graph that best represents this variation is option 2.
- The electric potential is constant inside the sphere and decreases inversely with distance outside the sphere.
Topper's Solved these Questions
- ELECTROSTATIC POTENTIAL AND CAPACITANCE Book:AAKASH INSTITUTEChapter:ELECTROSTATIC POTENTIAL AND CAPACITANCE Exercise:ASSIGNMENT SECTION - B
Explore 38 Videos
- ELECTROSTATIC POTENTIAL AND CAPACITANCE Book:AAKASH INSTITUTEChapter:ELECTROSTATIC POTENTIAL AND CAPACITANCE Exercise:ASSIGNMENT SECTION - C
Explore 53 Videos
- ELECTROSTATIC POTENTIAL AND CAPACITANCE Book:AAKASH INSTITUTEChapter:ELECTROSTATIC POTENTIAL AND CAPACITANCE Exercise:EXERCISE
Explore 20 Videos
- ELECTROMAGNETIC WAVESBook:AAKASH INSTITUTEChapter:ELECTROMAGNETIC WAVESExercise:ASSIGNMENT SECTION - D Assertion-Reason Type Questions
Explore 25 Videos
- GRAVITATION Book:AAKASH INSTITUTEChapter:GRAVITATION Exercise:ASSIGNMENT SECTION - D (ASSERTION-REASON TYPE QUESTIONS)
Explore 16 Videos
Similar Questions
Knowledge Check
Flux (ph) as a function of distance (r) from centre of uniformly charged solid sphere of charge Q and radius R, is best represented by
A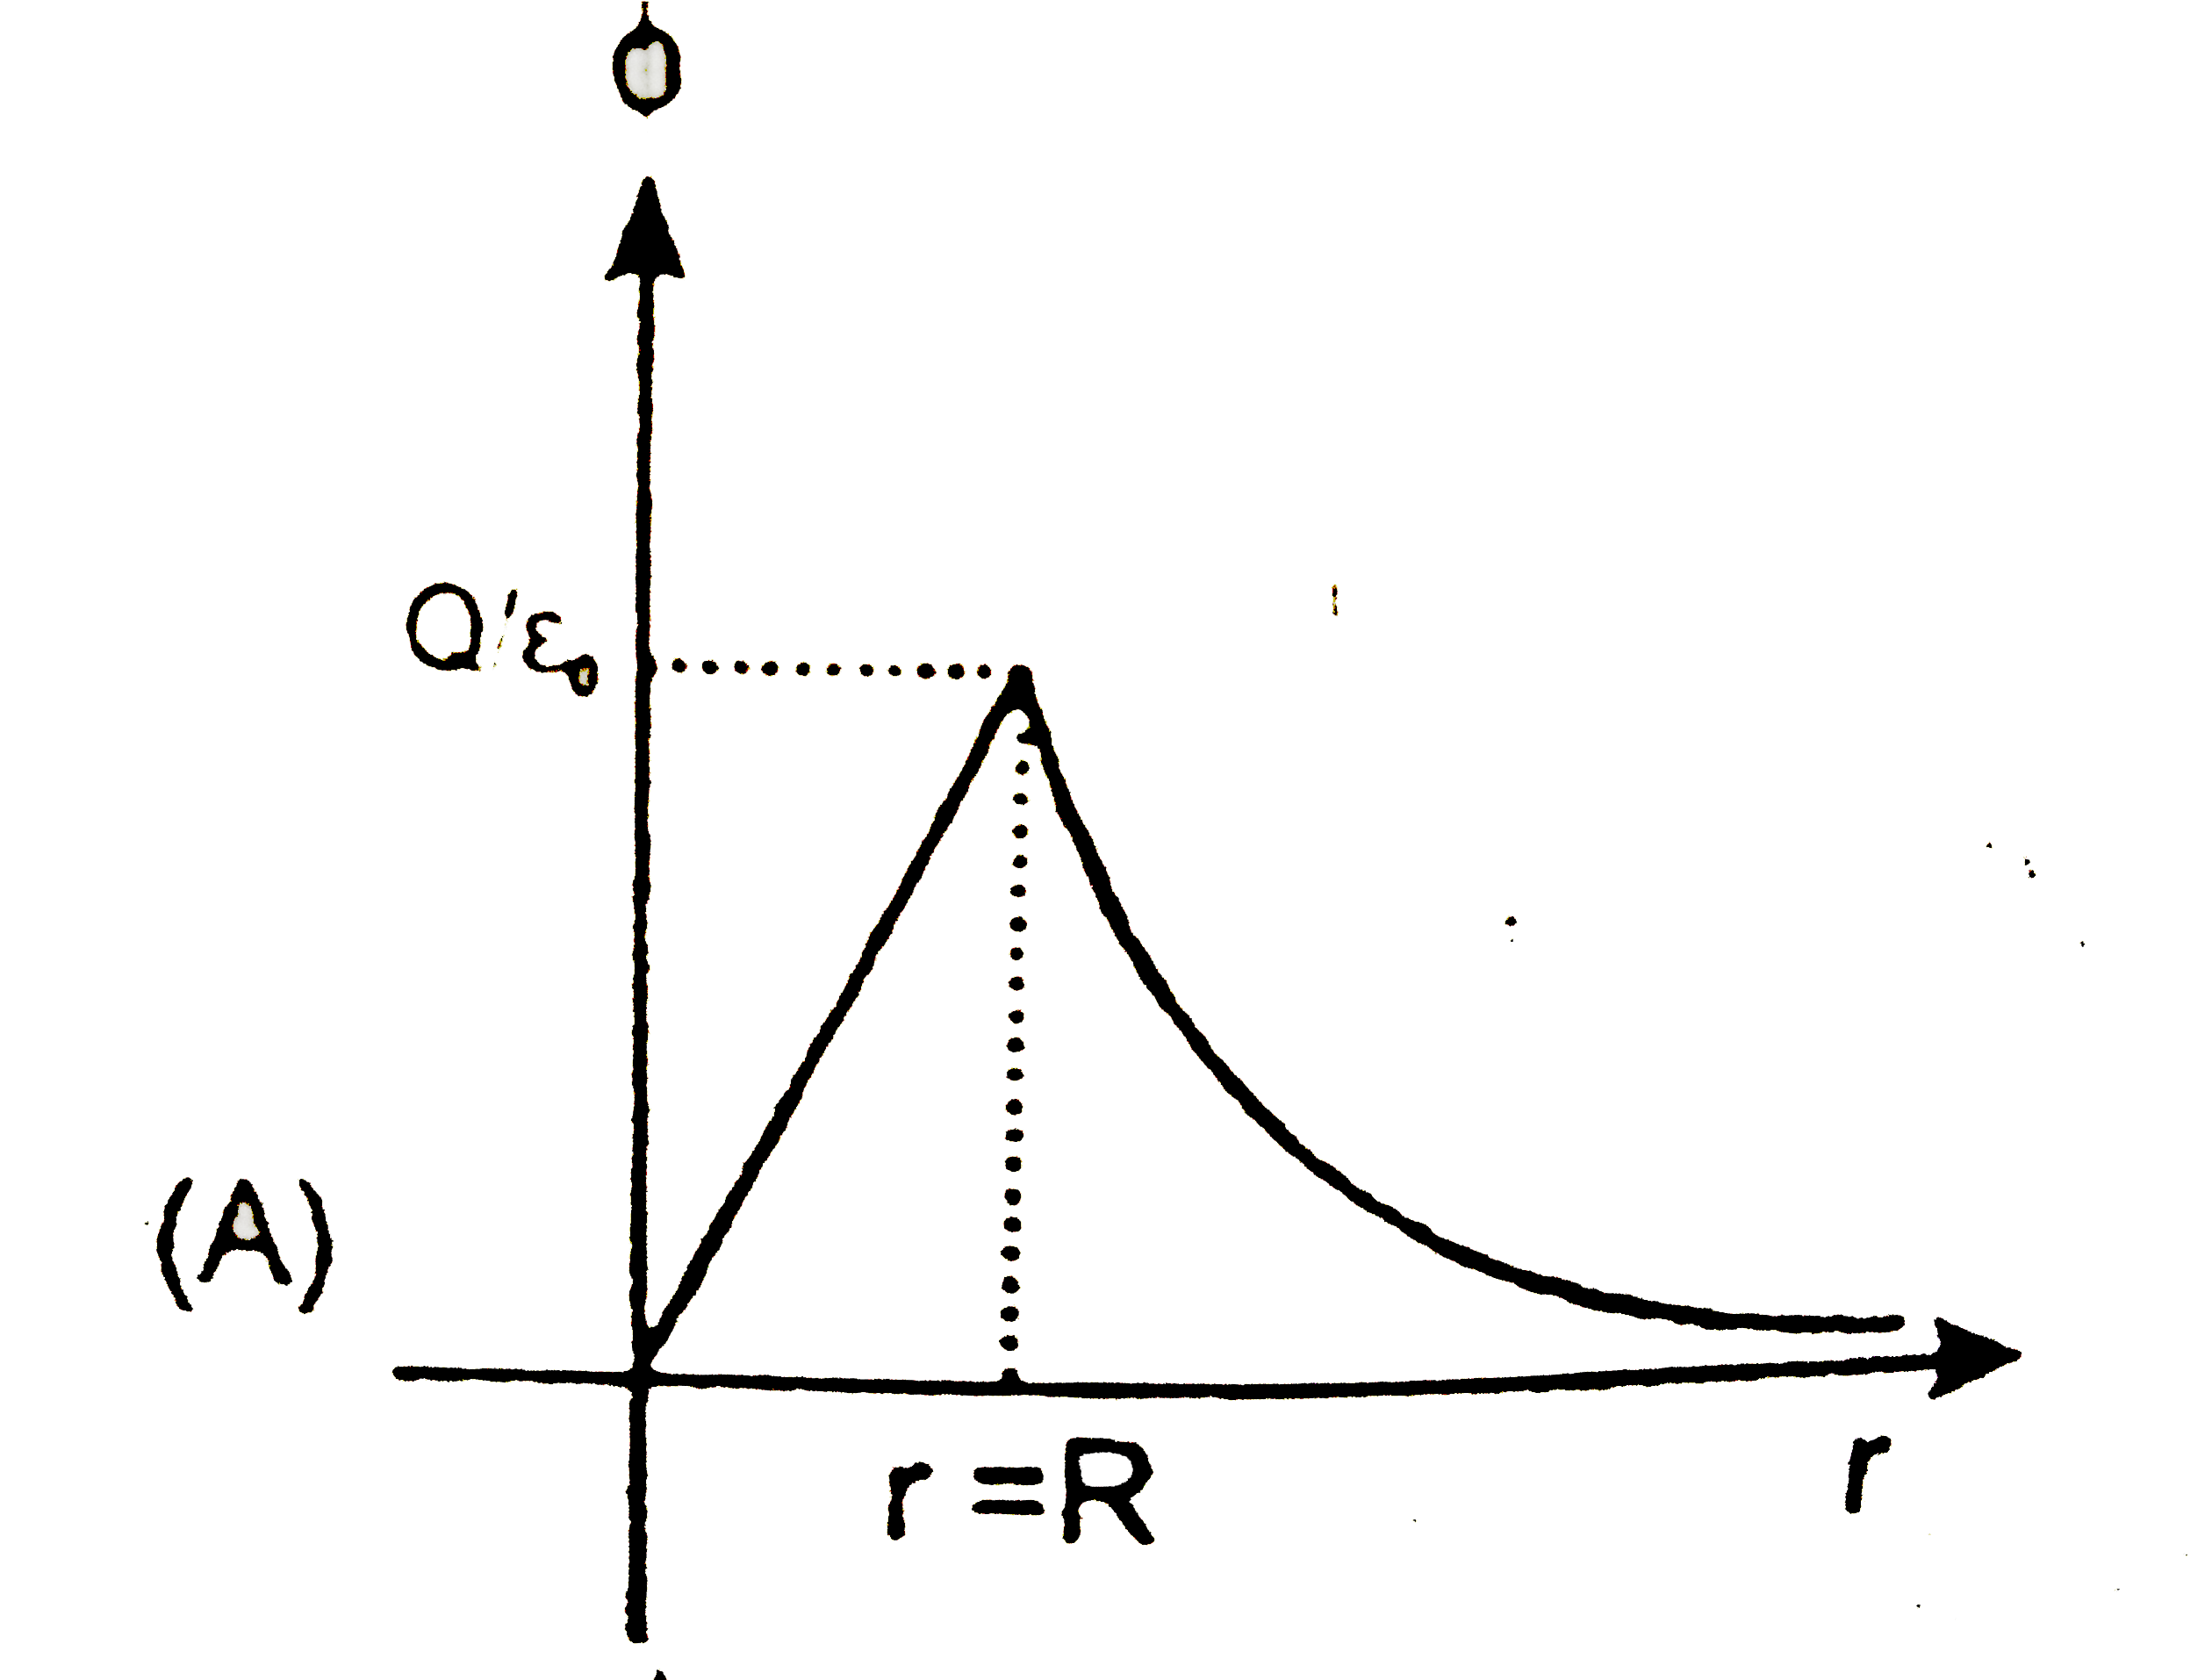 B
B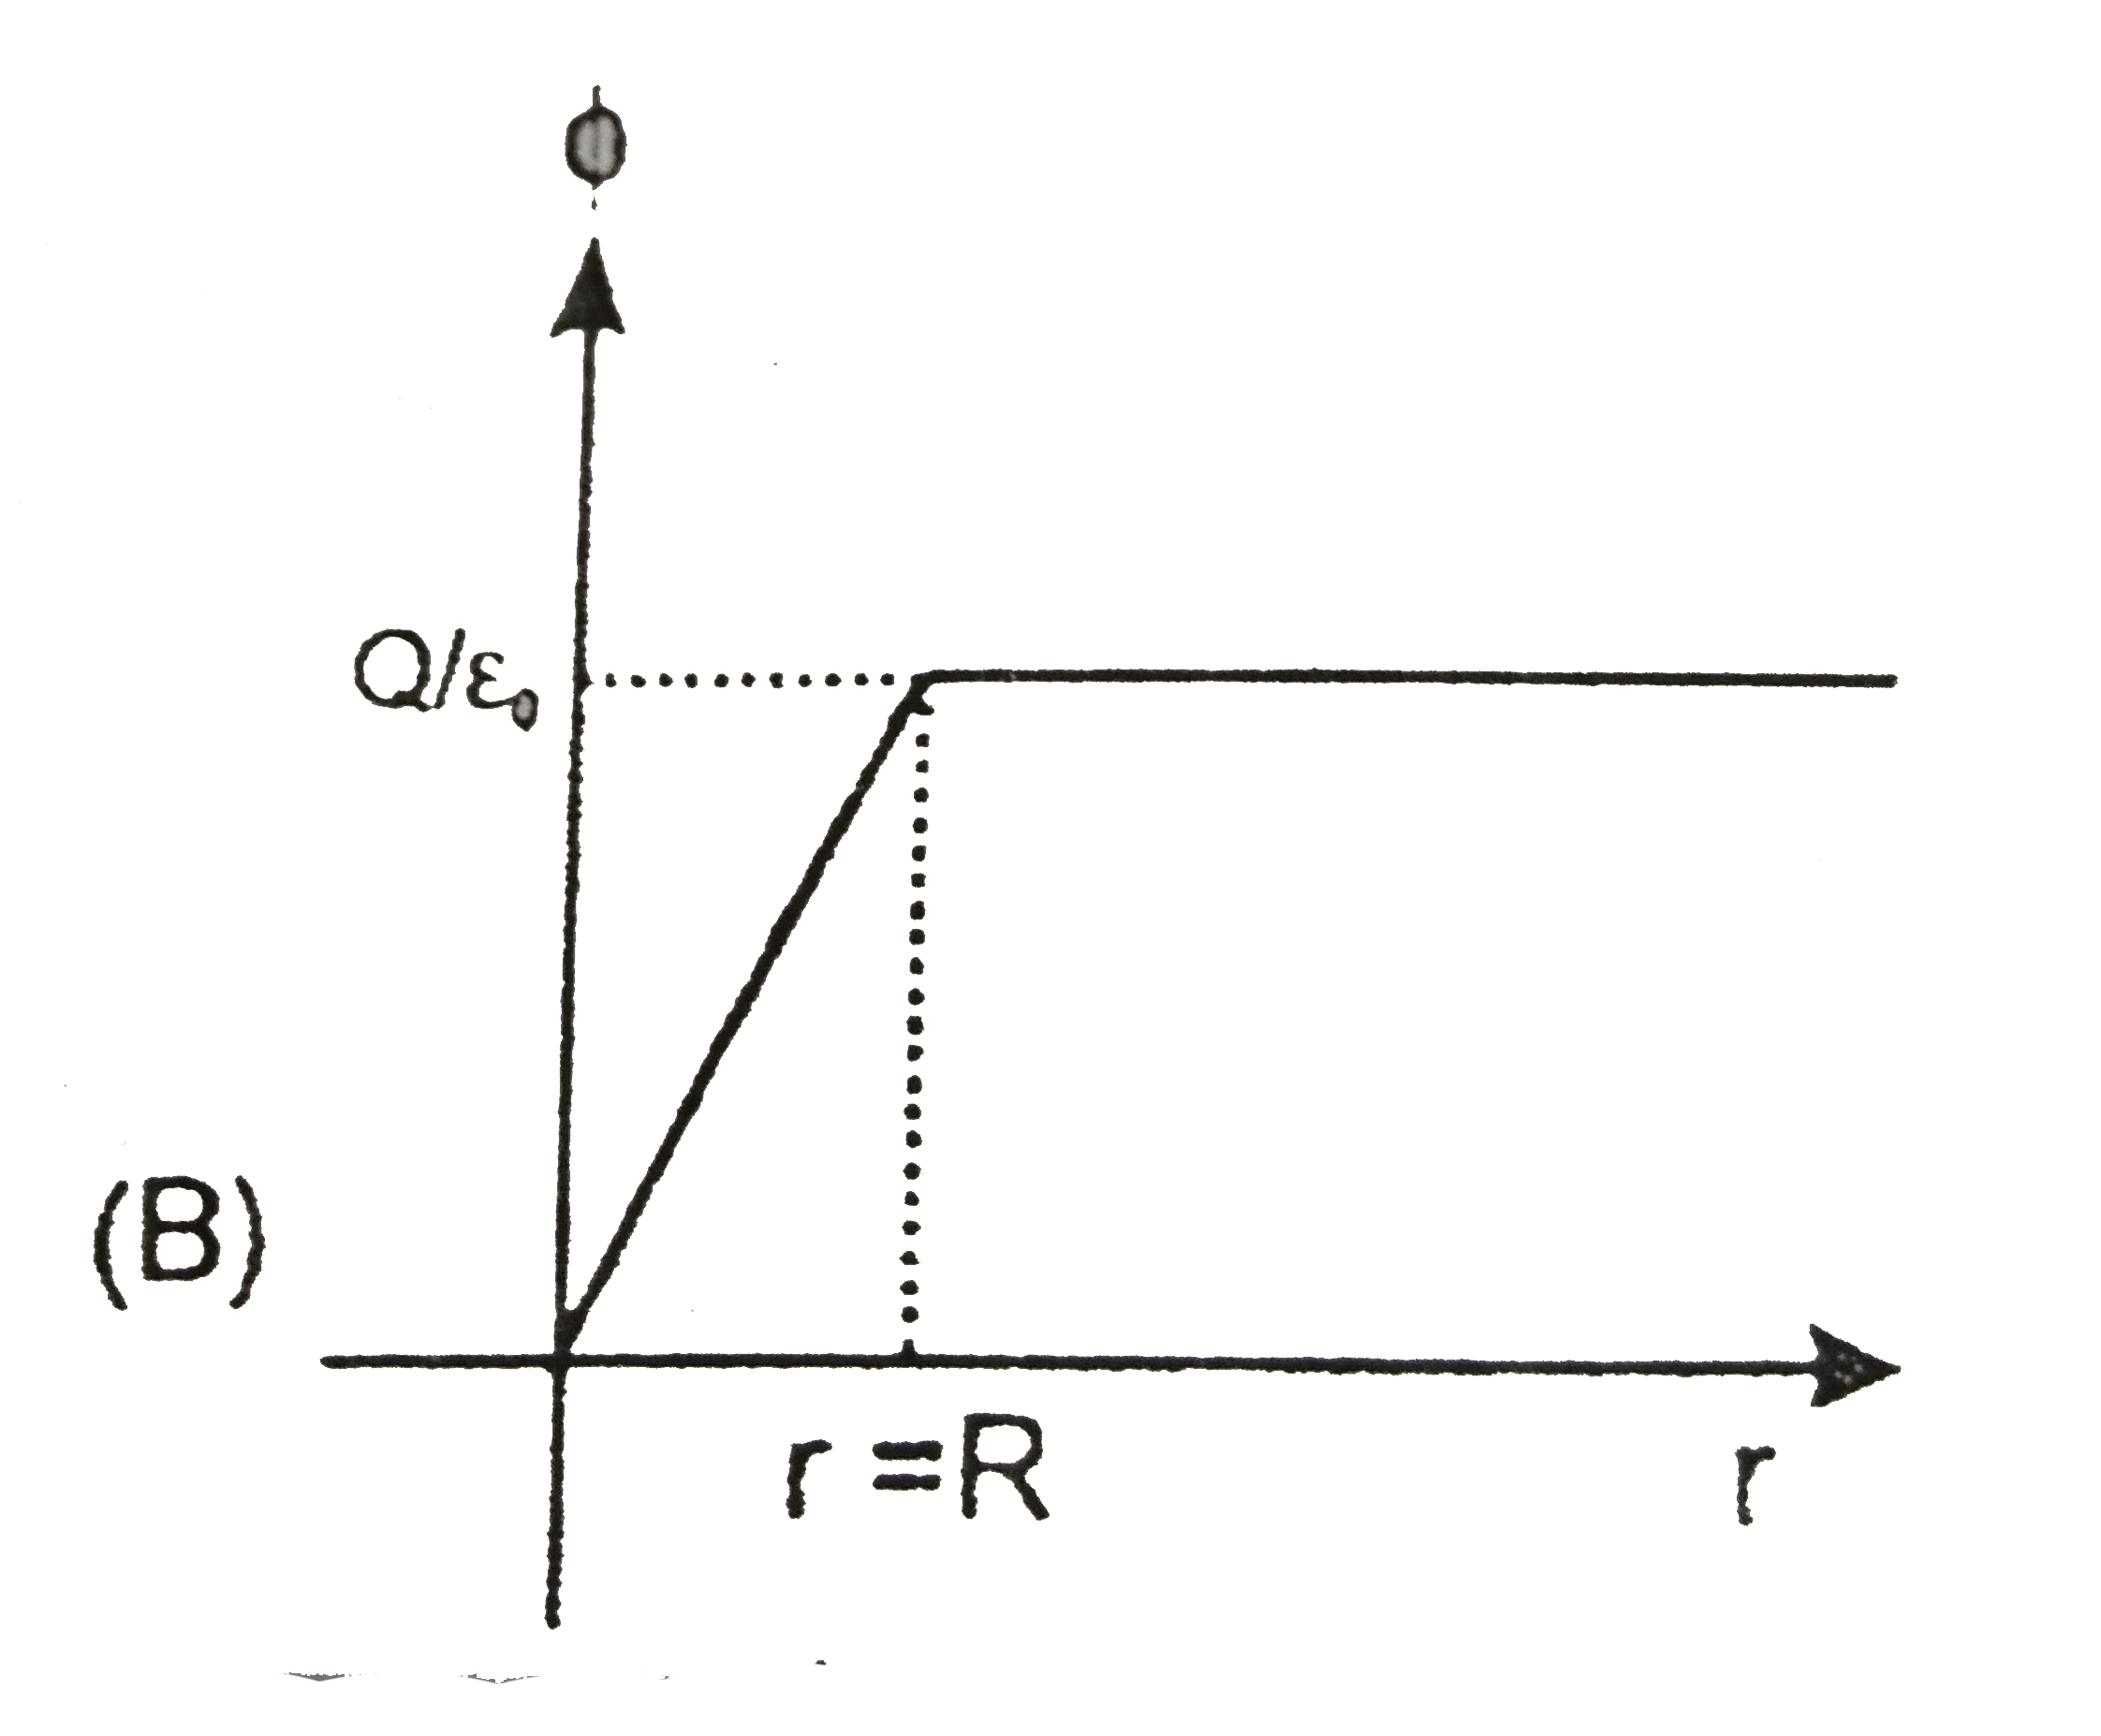 C
C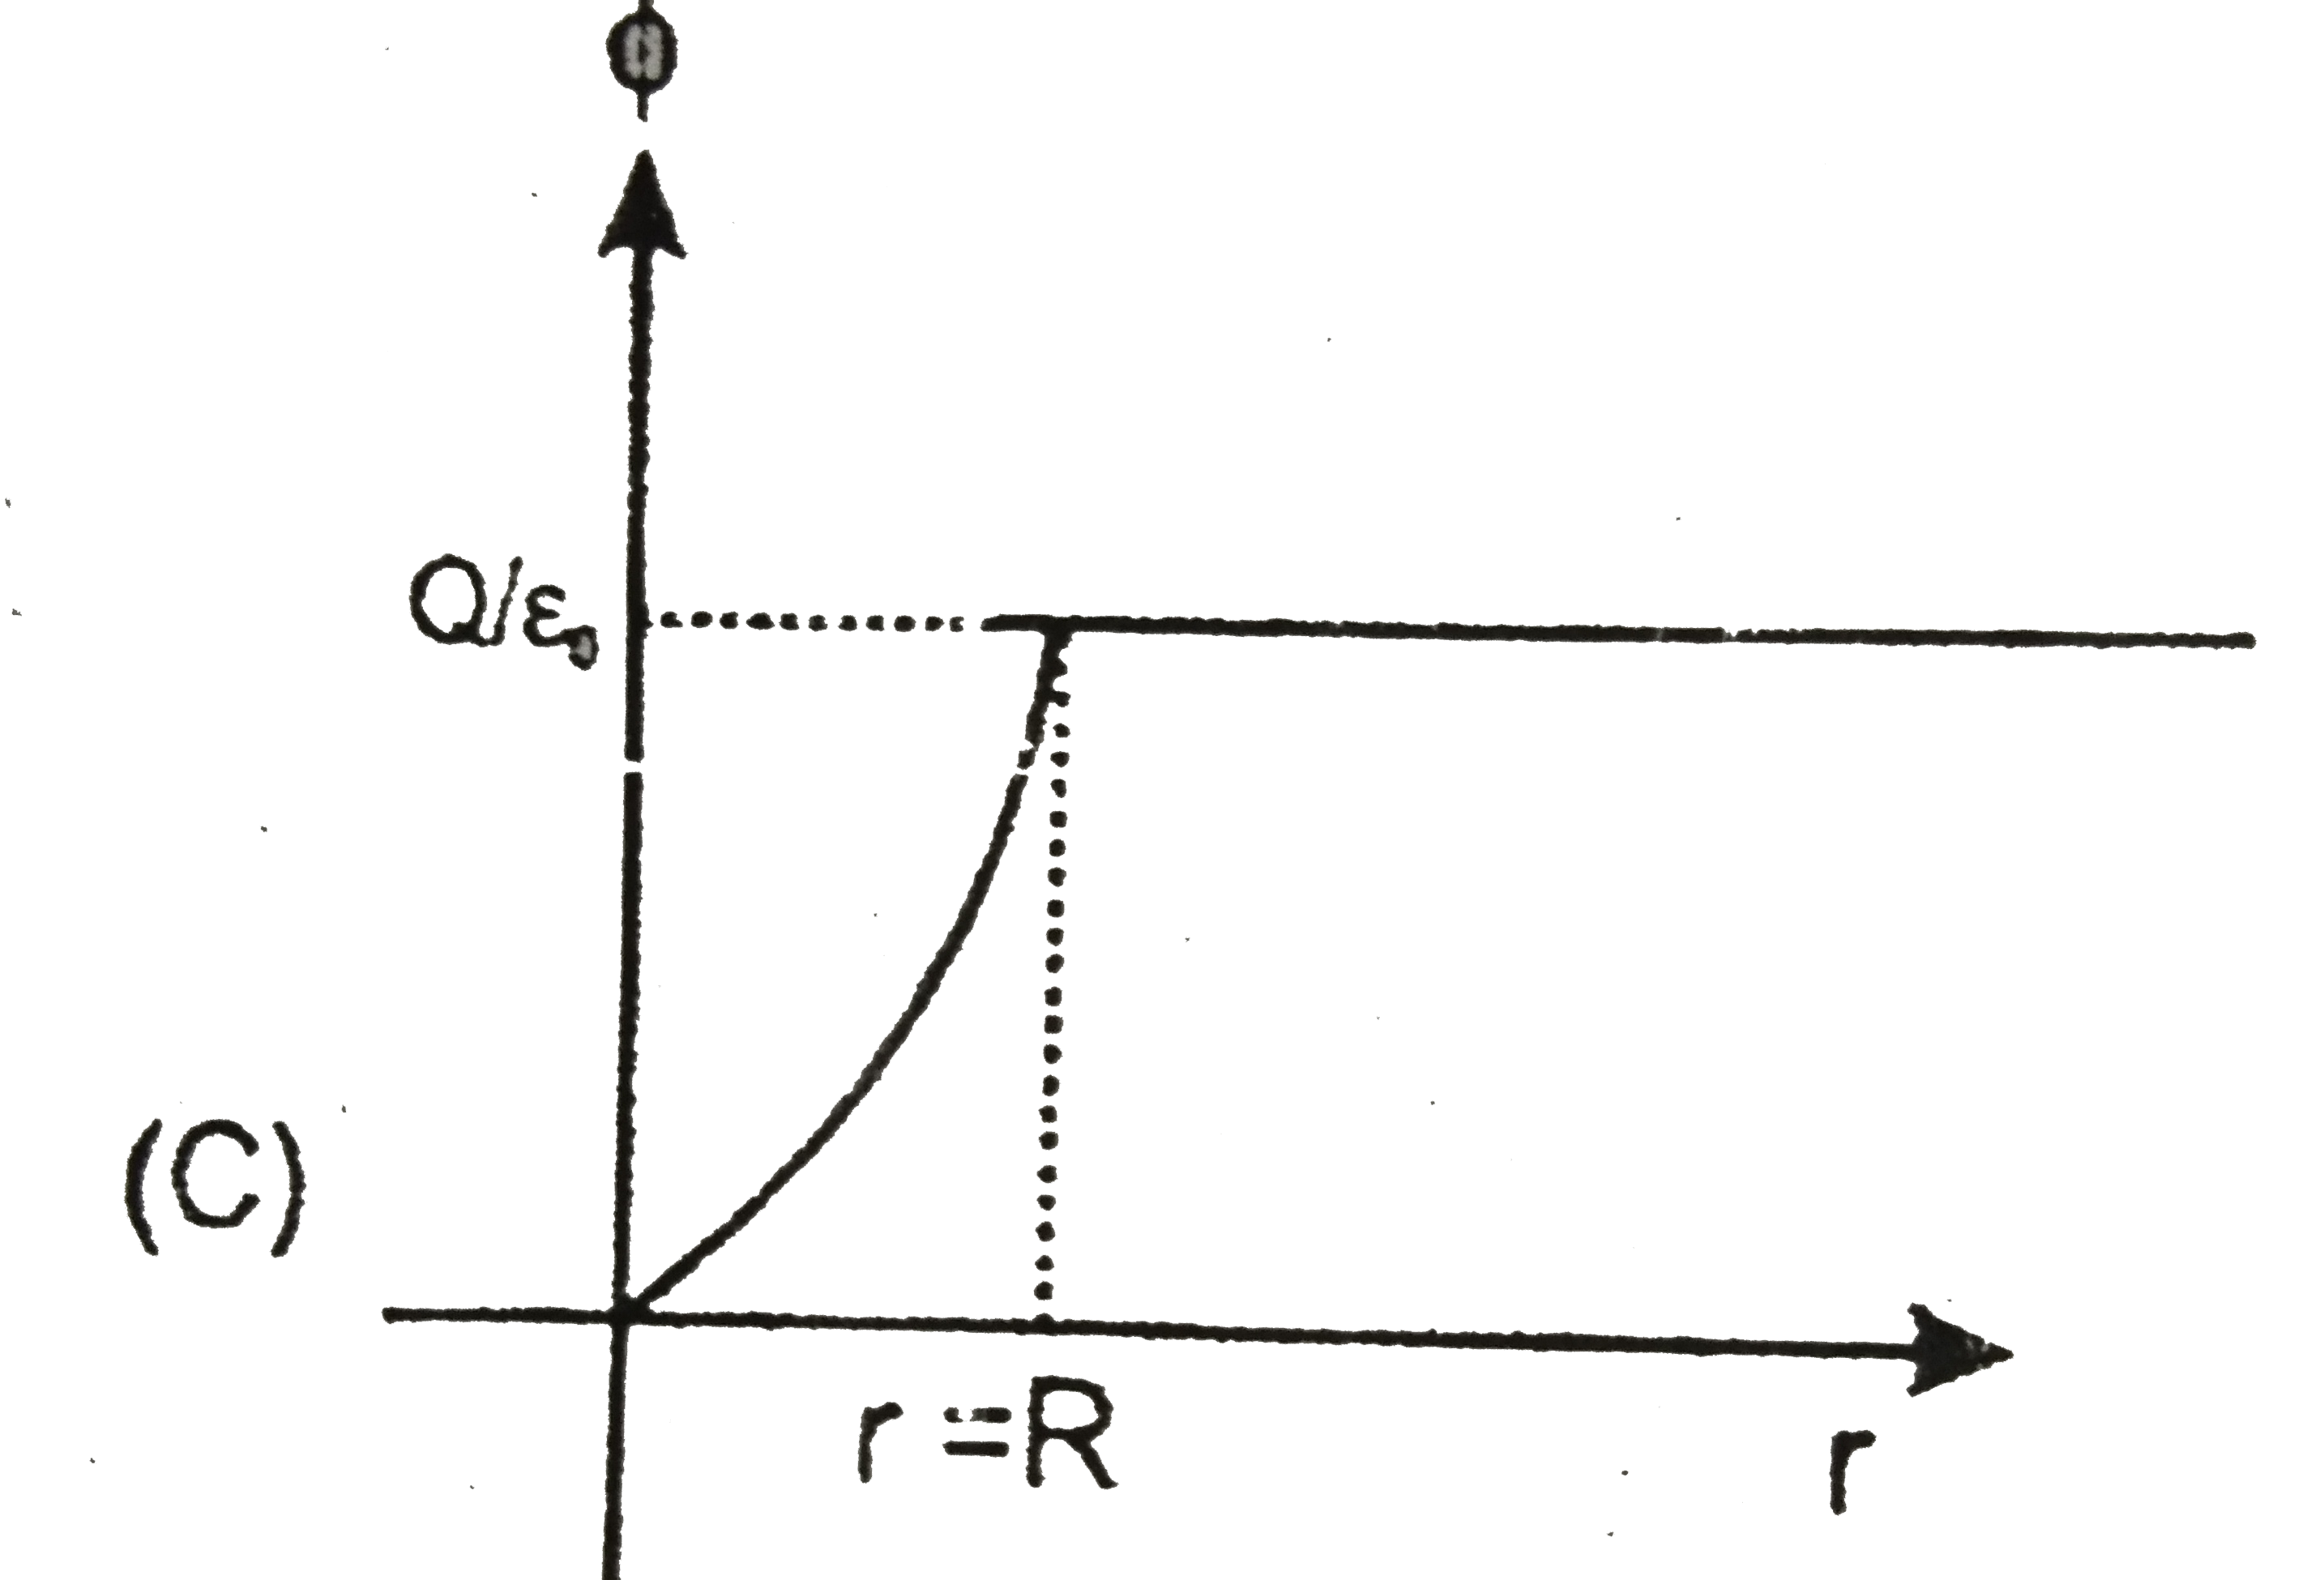 D
D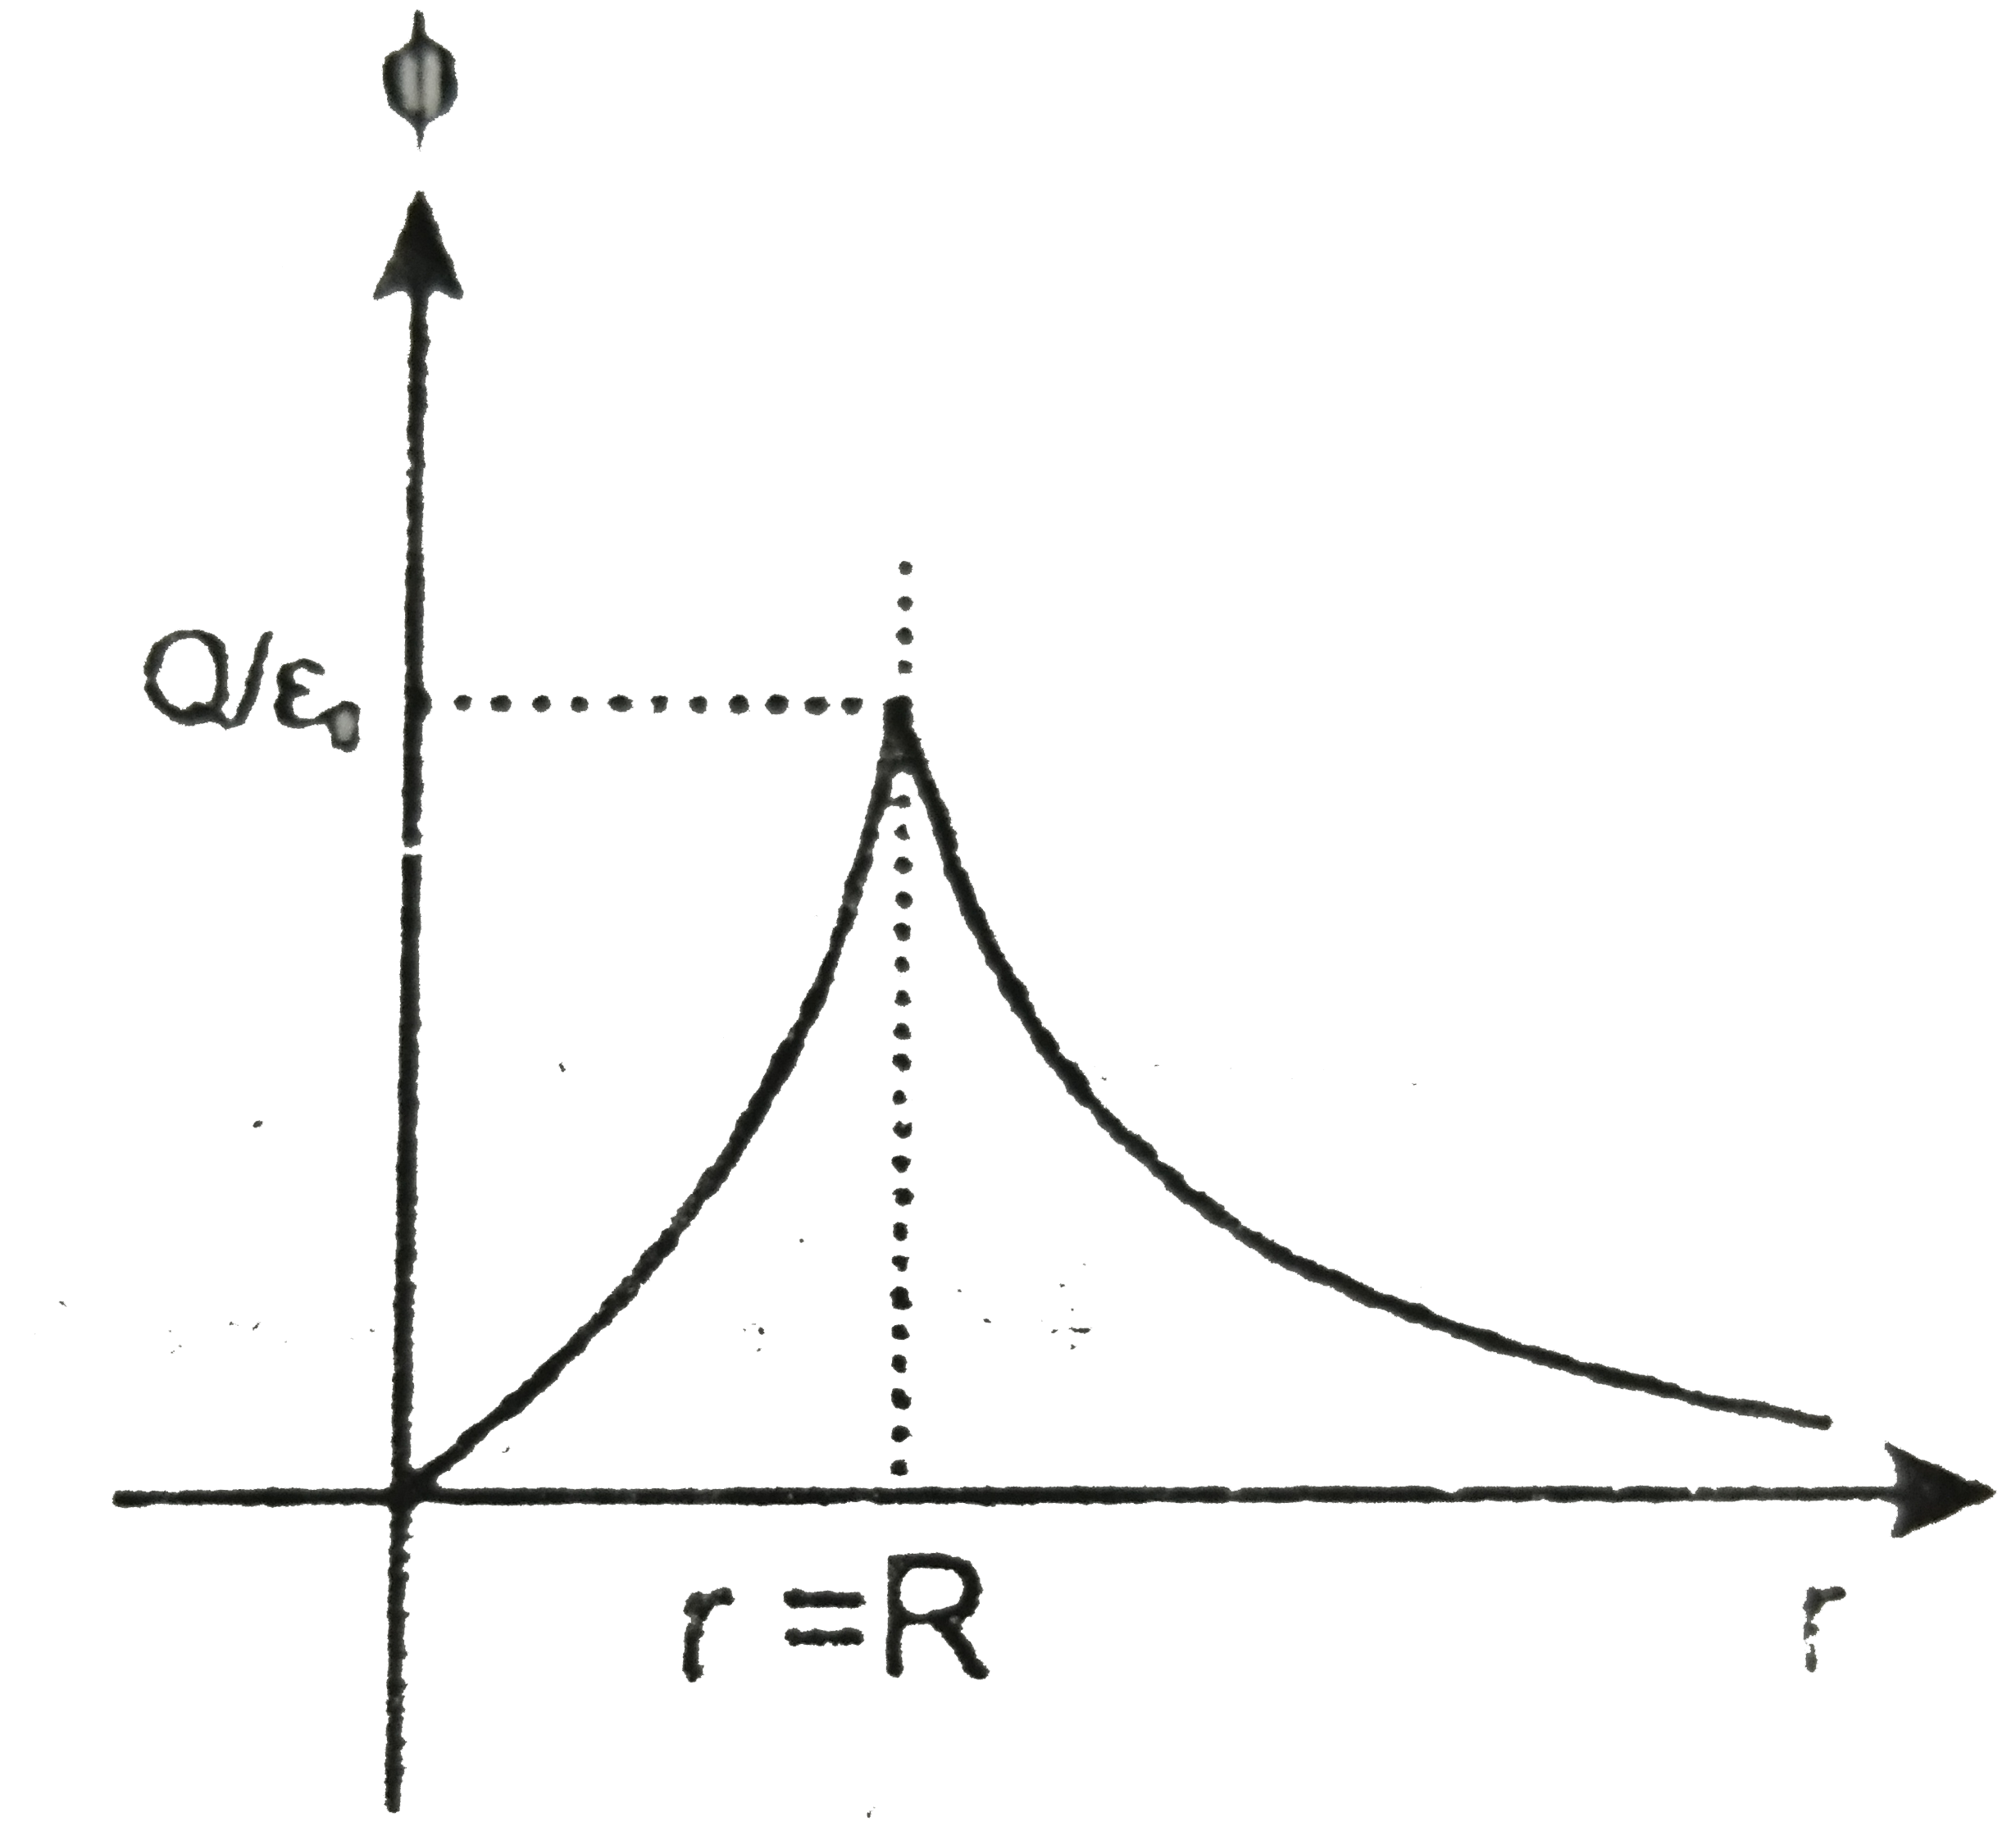
An isolated non-conducting solid sphere of radius R is given an electric charge. The charge is uniformly distributed in the volume of sphere. The graph which shows the correct variation of magnitude of electric field with distance from the centre of the sphere is
A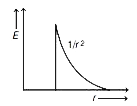 B
B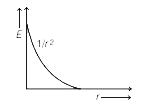 C
C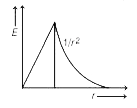 D
D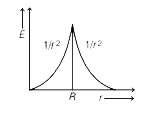
The variation of electrostatic potential with radial distance r from centre of positively charged metallic thin shell of radius R is given by graph
A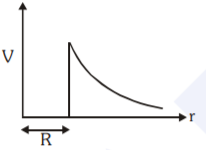 B##N∃TRE20_PHY33_O02##C##N∃TRE20_PHY33_O03##D##N∃TRE20_PHY33_O04##
Draw a plot showing variation of electric field with distance from the centre of a solid conducting sphere of radius R having a charge Q on its surface.
View SolutionGraphically represent the variation of electric potential and electric field due to point charge with respect to the distance from the point charge.
View SolutionWhich one of the following graphs represents the variation of electric field with distance r from the centre of a charged spherical conductor of radius R?
View SolutionGraph shows magnitude of electric field (E), charge enclosed (qenclosed⟩) within the concentic sphere and net flux (ϕ) through a concentric spherical Gaussian surface as a function of distance (r) from centre of a uniformly positive charged solid sphere of radius R. Choose the correct option (s):
View SolutionWhich of the following graph represents the variation of electric field E due to a thin charged spherical shell of radius R as a function of the distance r from the centre of the shell?
View Solution