The energy profile diagrams of two reactions are shown in the figure. Then

Reaction A→B is faster and more exothermic than reaction C→D
Reaction C→D is faster than reaction A→B but less exothermic
Reaction C→D is faster and more exothermic than the reaction A→B.
Reaction C→D212 times faster than reaction A→B at the same temperature
The correct Answer is:C
From C→D, activation energy is lesser than that of activation energy from A→B
Topper's Solved these Questions
- CHEMICAL KINETICS BOOK - NARAYNACHAPTER - CHEMICAL KINETICS EXERCISE - EXERCISE -1 (H.W) RATE OF REACTION & FACTORS
7 Videos
- CHEMICAL KINETICS BOOK - NARAYNACHAPTER - CHEMICAL KINETICS EXERCISE - EXERCISE -1 (H.W) ORDER OF REACTION
11 Videos
- CHEMICAL KINETICS BOOK - NARAYNACHAPTER - CHEMICAL KINETICS EXERCISE - EXERCISE -1 (C.W) (HALF-LIFE)
7 Videos
- CARBOXYLIC ACIDBOOK - NARAYNACHAPTER - CARBOXYLIC ACIDEXERCISE - All Questions
288 Videos
- CHEMISTRY IN EVERYDAY LIFEBOOK - NARAYNACHAPTER - CHEMISTRY IN EVERYDAY LIFEEXERCISE - ASSERTION & REASON TYPE QUESTIONS
10 Videos
Similar Questions
Substances which alter the velocity of a reaction by mere presence, without undergoing any change in mass and compossition are termed catalyst and the phenomenon is known as catalysis
For the reaction (A→B+C) , the energy profile diagram is given in the figure below.
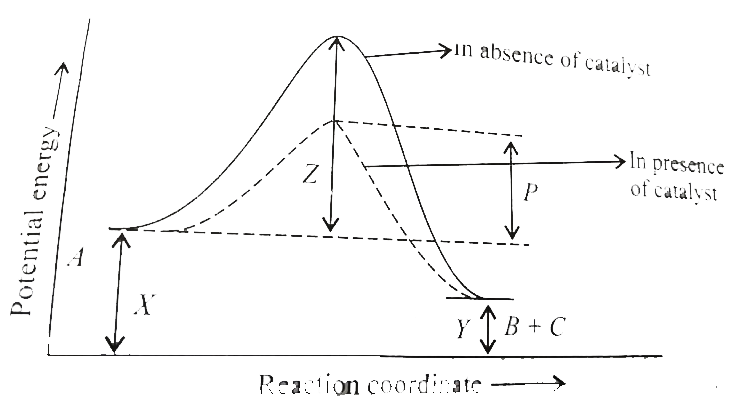
The decrease in the energy of activation in the presence of catalyst is
View SolutionThe following diagram represents the energy profile diagram for a two-step reaction. Calculate the ratio of change in heat energy involved in step I to step II.
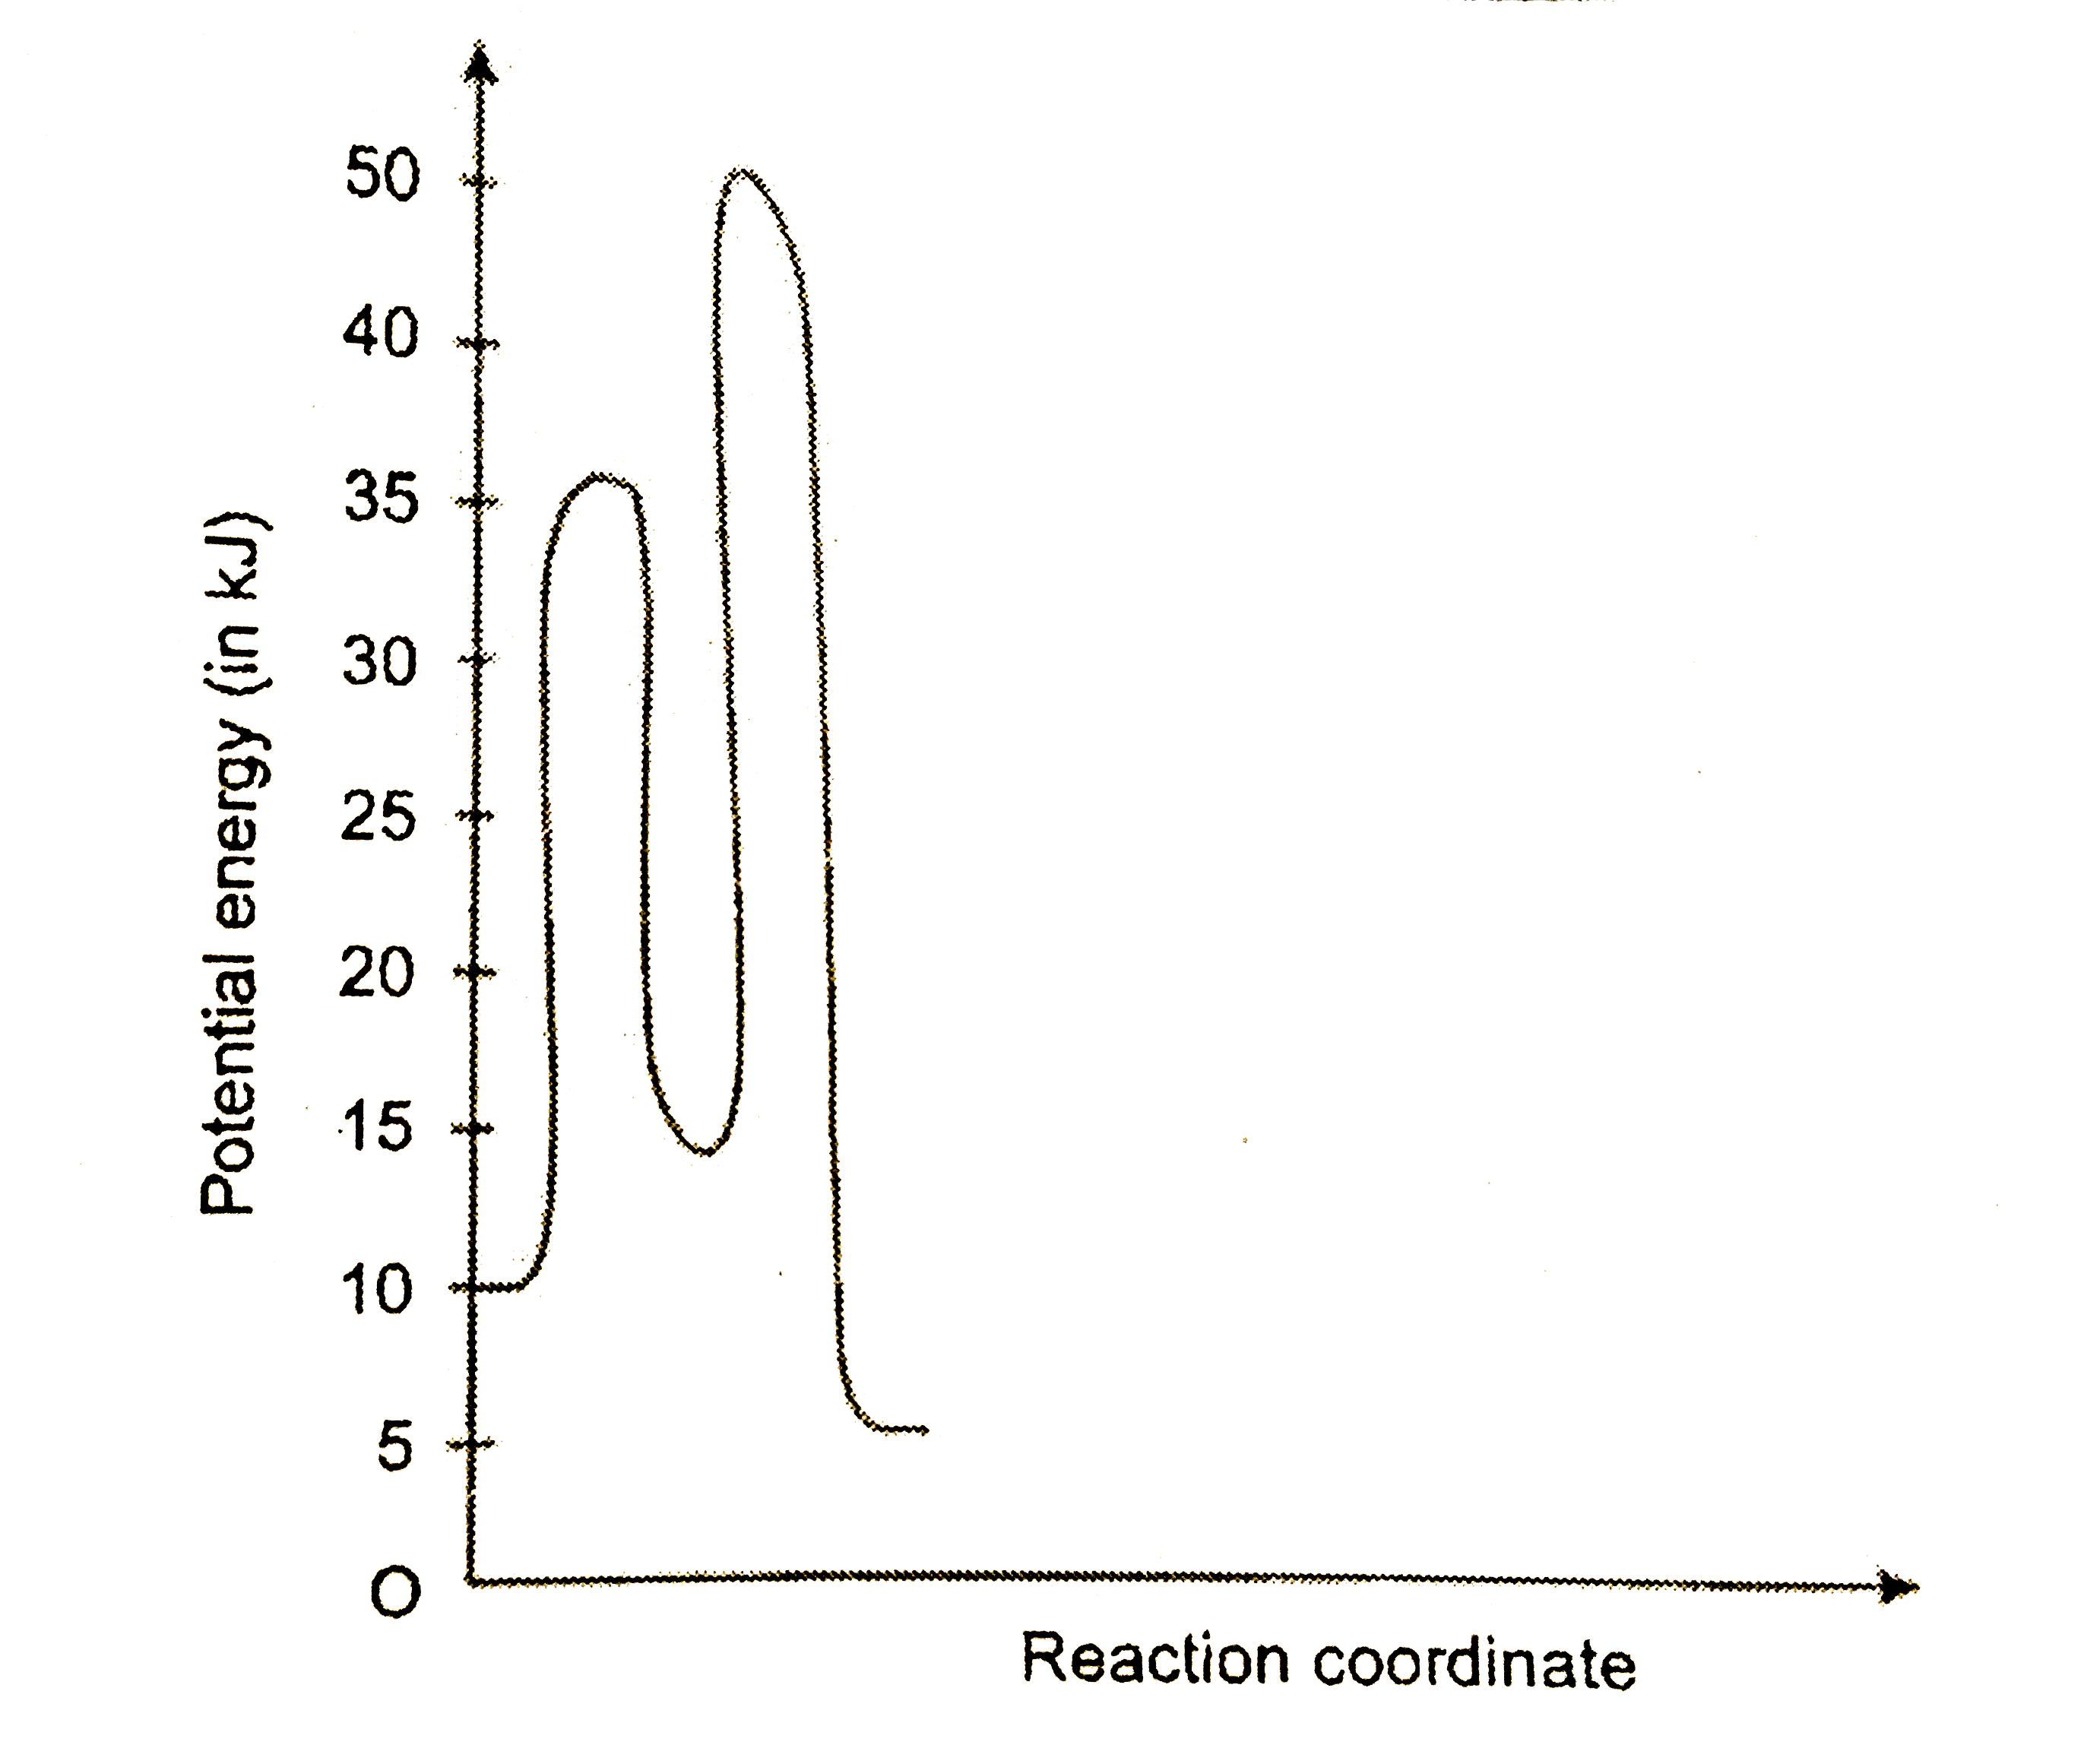
View Solution
Knowledge Check
For the energy profile diagram

Heat of reaction will beA100 kJ/moleB-100 kJ/moleC50 kJ/moleD-50 kJ/moleSubstances which alter the velocity of a reaction by mere presence, without undergoing any change in mass and compossition are termed catalyst and the phenomenon is known as catalysis
For the reaction (A→B+C) , the energy profile diagram is given in the figure below.

The decrease in ht eenergy of activation in hte presence of catalyst isAZBZ−PCY−ZDZ−XFor a chemical reaction, a plot of energy versus the progress of reaction can be represented as shown in the figure.
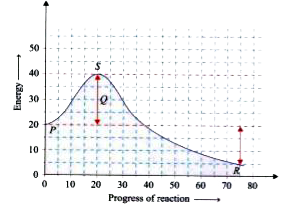
The following are true:AP=ER, Q = threshold energyBP=ER, Q = activation energyCR=Ep, S = activation energyDR=Ep, S = threshold energy
The energy profile of the reaction: is shown as A+B⇔C is shown as,
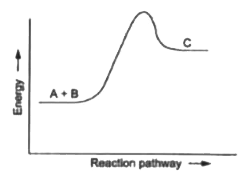
The equilibrium constant for the said equilibrium
View SolutionDraw an energy profile diagram for a three step reaction in which first step is slowest and last step is fastest. (Assume that reaction is exothermic)
View SolutionDraw an energy profile diagram for a three step-reaction in which first step is slowest and last step is fastest. (Assume that reaction is exothermic)
View SolutionGiven is the energy profile diagram of nitration of benzene using mixed acid (HNO3+H2SO4)
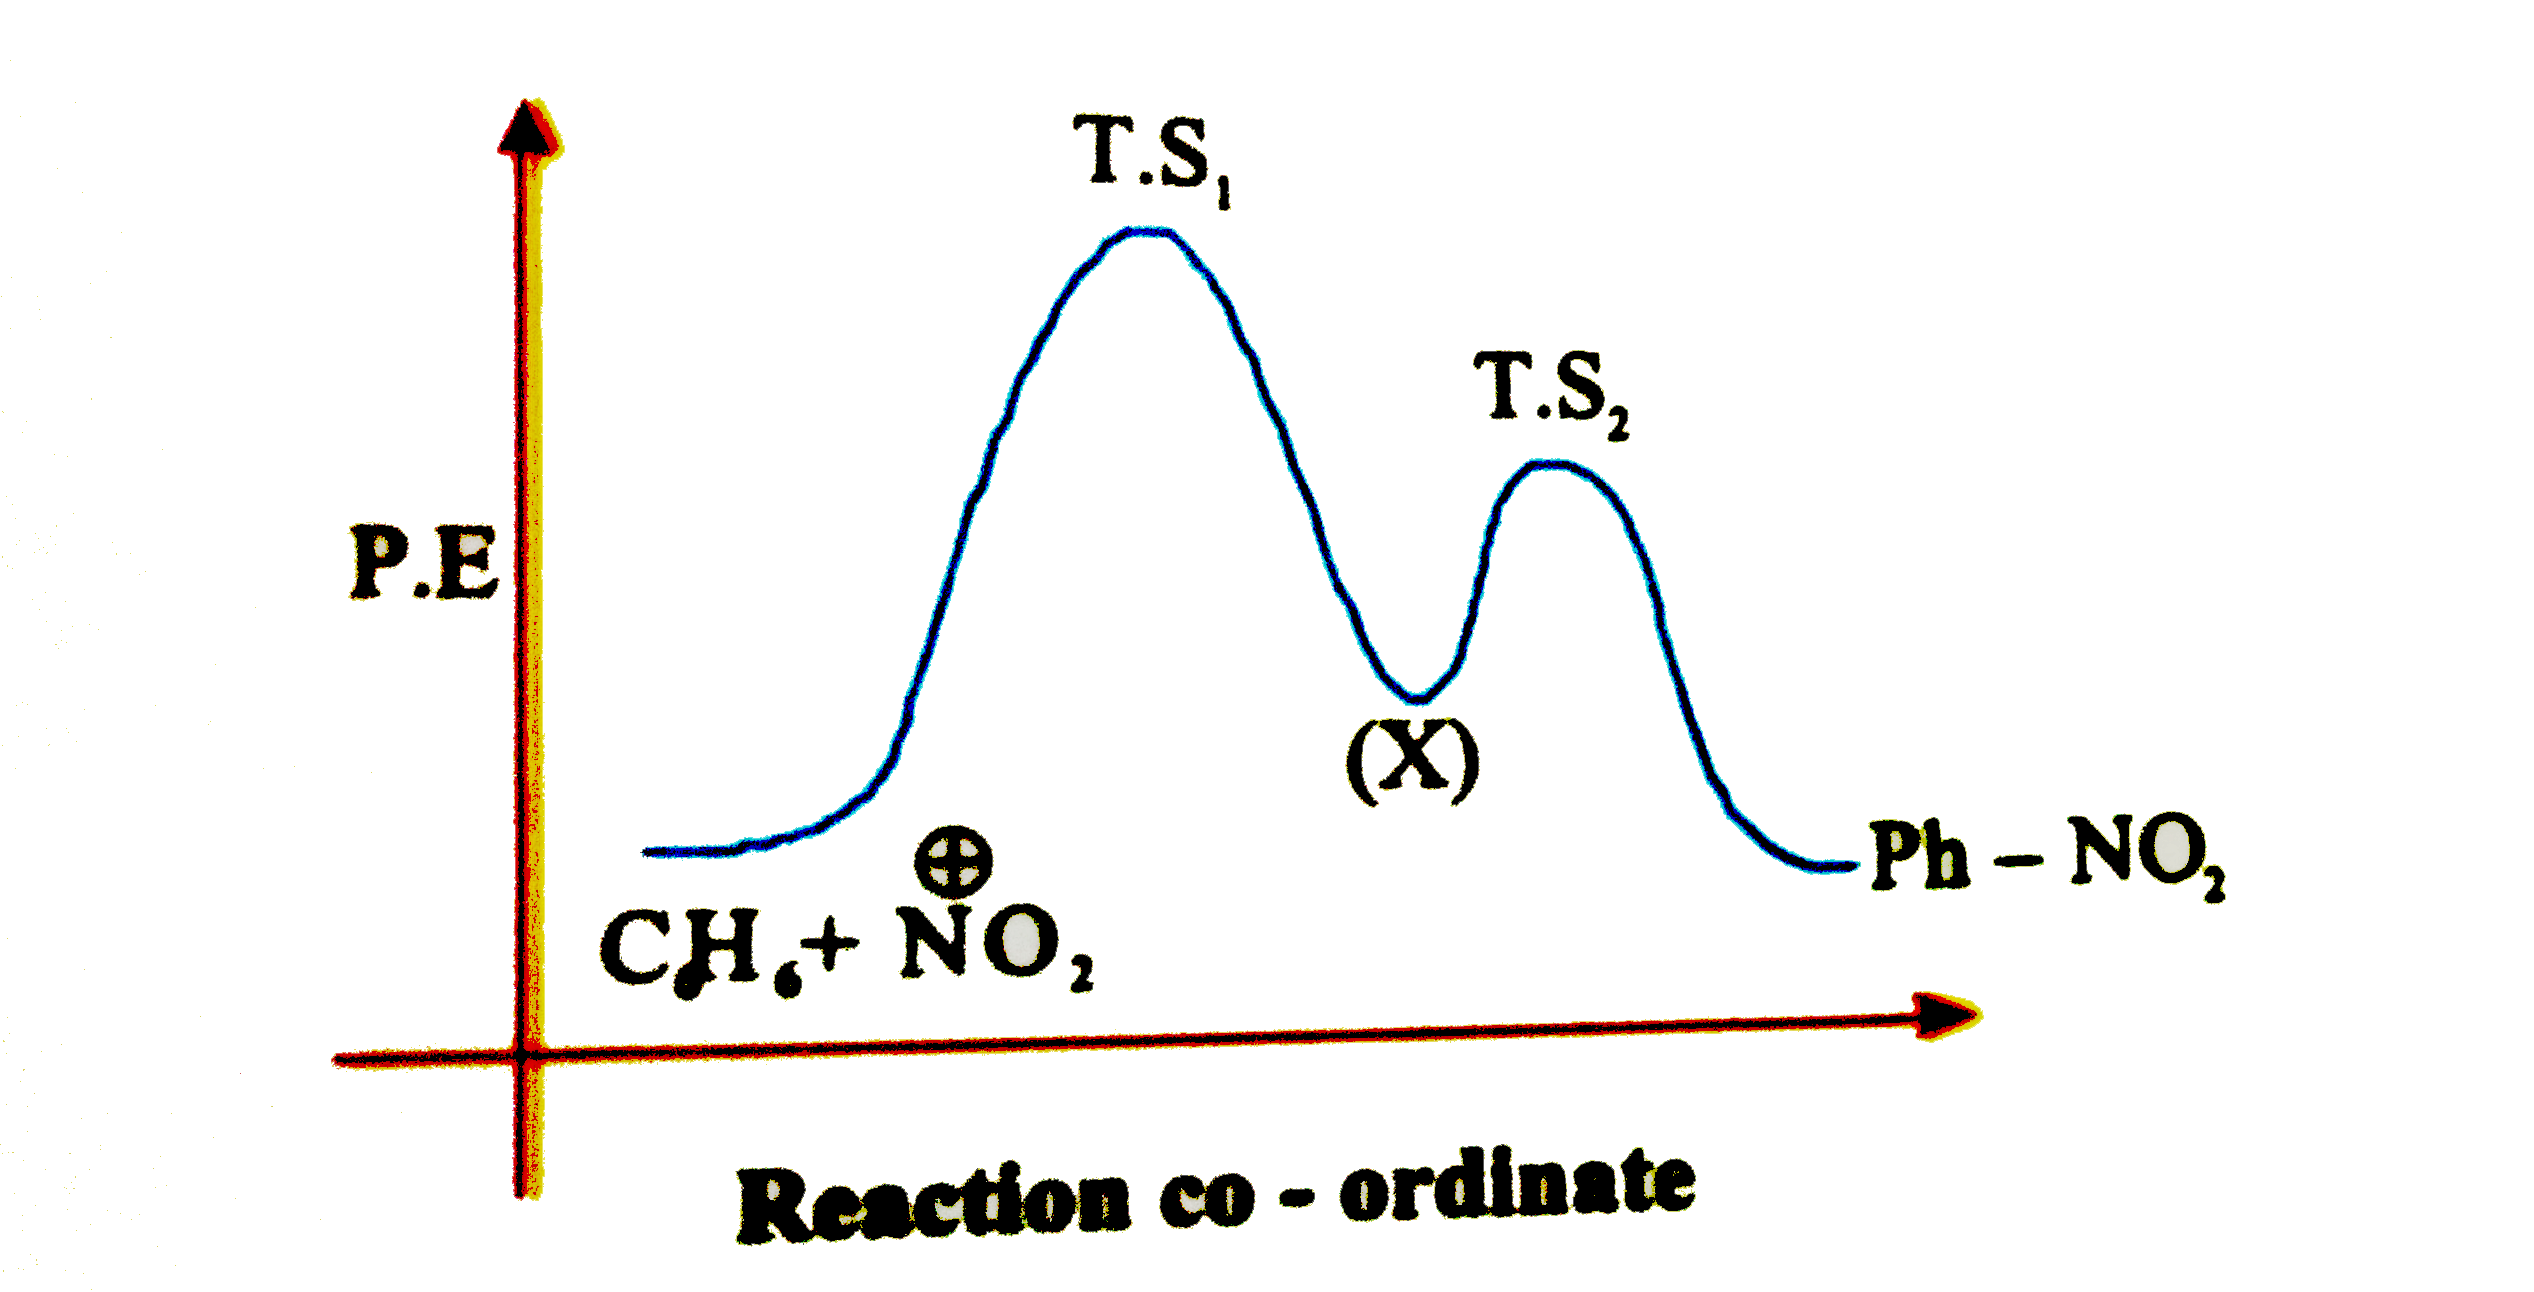
Q. Identify (X) in above reaction
View SolutionGiven is the energy profile diagram of nitration of benzene using mixed acid. (HNO3+H2SO4)
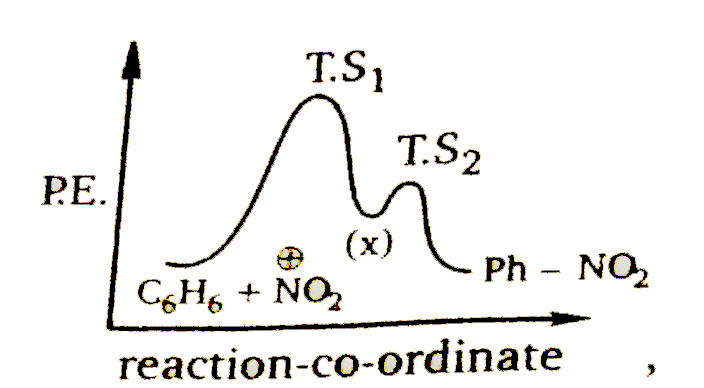
Identify (x) in above reaction:
View Solution
