During the period 1960 to 2000 , rice production increased from
11 million tones to 75 million tonners
35 million tonnes to 89.5 million tonnes.
350 million tonnes to 899.5 million tonnes.
110 million tonners to 750 million tonnes.
The correct Answer is:B
Step-by-Step Solution:
1. Understanding the Context: The question asks about the increase in rice production in India from the year 1960 to 2000. To answer this, we need to know the rice production figures for these years.
2. Historical Background: After India's independence, rice production was relatively low, making it challenging to feed the growing population. This led to the import of rice from other countries.
3. Introduction of Dwarf Varieties: In the 1960s, a significant breakthrough occurred with the discovery of a dwarf gene in Taiwan. This gene was crucial in developing semi-dwarf rice varieties.
4. Development of Semi-Dwarf Varieties: The semi-dwarf varieties that emerged from this research included notable names such as Taiwan, Jaya, Ratna, IR8, IR24, and Taichung native variety. These varieties were instrumental in increasing rice yield.
5. Impact on Rice Production: The introduction of these semi-dwarf varieties led to a doubling of rice production, contributing to what is known as the Green Revolution in India.
6. Rice Production Figures: Specifically, rice production increased from 35 million tonnes in 1960 to 89.5 million tonnes in 2000.
7. Conclusion: Therefore, the correct answer to the question is that rice production increased from 35 million tonnes to 89.5 million tonnes during the period from 1960 to 2000.
Final Answer: Rice production increased from 35 million tonnes to 89.5 million tonnes during the period 1960 to 2000.
---
Similar Questions
During the period 1960 to 2000, wheat production increased from _____to_____whereas rice production went up from_____to______
View SolutionIdentify true or false statements
(i) Conventional plant breeding is in practice from 9,000−11,000 years ago.
(ii) Recombinant progeny is self -pollinated for several generations till they reach a state of heterozygosity
(iii) During the period 1960 to 2000 wheat production increased from 35 million tonnes to 89.5 million tonnes.
View Solution
Knowledge Check
Assertion : During the period 1960 to 2000, rice production increased form 11 million tonnes to 75 million tonnes while wheat production went up from 35 million toones to 89.5 million tonnes.
Reason : Norman E. borlaug, at IRRI developed semidwarf wheat and rice.AIf both assertion and reason are true and the reason is the correct explanation of the assertionBIf both assertion and reason are true but reason is not the correct explanation of the assertionCIf assertion is true but reason is falseDIf both assertion and reason are falseDuring the period 1960 to 2000, wheat production increased from
A11 million tones to 75 million tonnesB35 million tonnes to 89.5 million tonnes.C350 million tonnes to 899.5 million tonnes.D110 million tonners to 750 million tonnes.During the period between 1973 to 2003, the production has increased most in the
AMain sectorBPrimary sectorCTertiary sectorDNone of these
Select the incorrect statements. Br a. Indian agriculture accounts for approximately 62 percent of India's GDP. Br b. During the period 1960 and 2000, wheat and rice production increased from 11 million tonnes to 89.5 million tonnes. Br C. Semi-dwarf rice varieties were derived from IR 8 and Taichung Native-1. br d. Saccharum officinarum was originally grown in south india having high sugar content and yield.
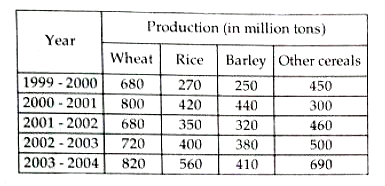
View SolutionThe following table shows the productions of food-grains (in million tons) in a state for the period 1999-2000 to 2003-2004. Read the table and answer the questions

During the period 1999-2000 to 2003-2004, x percent of the total production is production of wheat. The value of x is about
View SolutionYield of rice is increased by
View SolutionThe following table shows the productions of food-grains (in million tons) in a state for the period 1999 - 2000 to 2003 - 2004. Read the table and the questions.

During the period 1999 - 2000 to 2003 - 2004, x per cent of the total production is production of wheat. The value of x is about :
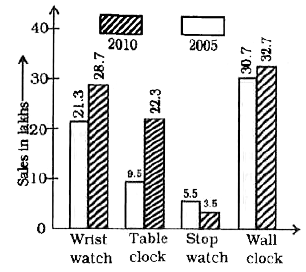
View SolutionA watch company produced four different products. The sales of these products in lakhs during 2005 and 2010 are shown in the following bar diagram. Study the graph and answer the questions.

During the period 2005-2010 the minimum rate of increase in sales in the product of
View Solution
