The following table gives the income distribution of 200 households of a village: Monthly income (in Rs.) Number of households <1000 25 <2000 80 <5000 170 <10000 200 What is the percentage of households whose monthly income is above Rs. 2000 but below Rs. 5000? b. c. d.
To find the percentage of households whose monthly income is above Rs. 2000 but below Rs. 5000, we can follow these steps:
Step 1: Identify the number of households in the income range
From the table, we have:
- Total households with income < Rs. 2000 = 80
- Total households with income < Rs. 5000 = 170
To find the number of households with income between Rs. 2000 and Rs. 5000, we subtract the number of households with income less than Rs. 2000 from those with income less than Rs. 5000.
Calculation:
Number of households with income between Rs. 2000 and Rs. 5000 = Number of households with income < Rs. 5000 - Number of households with income < Rs. 2000
= 170 - 80 = 90 households
Step 2: Calculate the percentage of these households
Now, we need to find the percentage of these 90 households in relation to the total number of households, which is 200.
Calculation:
Percentage = (Number of households with income between Rs. 2000 and Rs. 5000 / Total number of households) × 100
= (90 / 200) × 100
= 0.45 × 100 = 45%
Conclusion
The percentage of households whose monthly income is above Rs. 2000 but below Rs. 5000 is 45%.
Final Answer
b. 45
---
From the table, we have:
- Total households with income < Rs. 2000 = 80
- Total households with income < Rs. 5000 = 170
Number of households with income between Rs. 2000 and Rs. 5000 = Number of households with income < Rs. 5000 - Number of households with income < Rs. 2000
Now, we need to find the percentage of these 90 households in relation to the total number of households, which is 200.
Percentage = (Number of households with income between Rs. 2000 and Rs. 5000 / Total number of households) × 100
The percentage of households whose monthly income is above Rs. 2000 but below Rs. 5000 is 45%.
b. 45
Topper's Solved these Questions
Similar Questions
The following table gives less than' type frequency distribution of income per day:
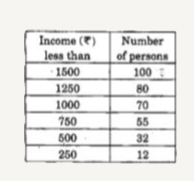
What is the modal class ?
View SolutionThe following data gives the distribution of total monthly household expenditure of 200 families of a village. Find the modal monthly expenditure of the families. Also, find the mean monthly expenditure:
View Solution
Knowledge Check
The given pie chart shows the monthly expenditure on various items and monthly savings of a household. The same distribution is followed for all the months of the year.
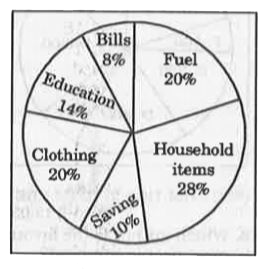
If monthly income is Rs. 50000, then how much is spent (in Rs.) on fuel?A12000B10000C13500D15000The given pie chart shows the monthly expenditure on various items and monthly savings of a household. The same distribution is followed for all the months of the year.
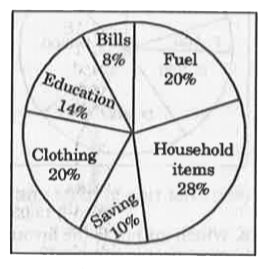
If monthly income is Rs. 65000, then what is the difference ()in Rs.) between expenditure on household items and clothing?A5200B6500C7200D4500
The following table gives the distribution of income of 100 families in a village. Calculate the standard deviation: Income Rs. 0-1000 1000-2000 2000-3000 3000-4000 4000-5000 5000-6000 No. of Families 18 26 30 12 10 4
View SolutionThe following data gives the distribution of total household expendilture ( in Rs.) of workers is a city :

Find the average expenditure which is being done by maximum number of manual workers.
View SolutionThe following table gives the distribution of income of 100 families in a village. Calculate the standard deviation: Income Rs., 0-1000, 1000-2000, 2000-3000, 3000-4000, 4000-5000, 5000-6000 No. of Families, 18, 26, 30, 12, 10, 4
View SolutionRewa spends 75% of her income and saves Rs. 2000 per month. What is her monthly income ?
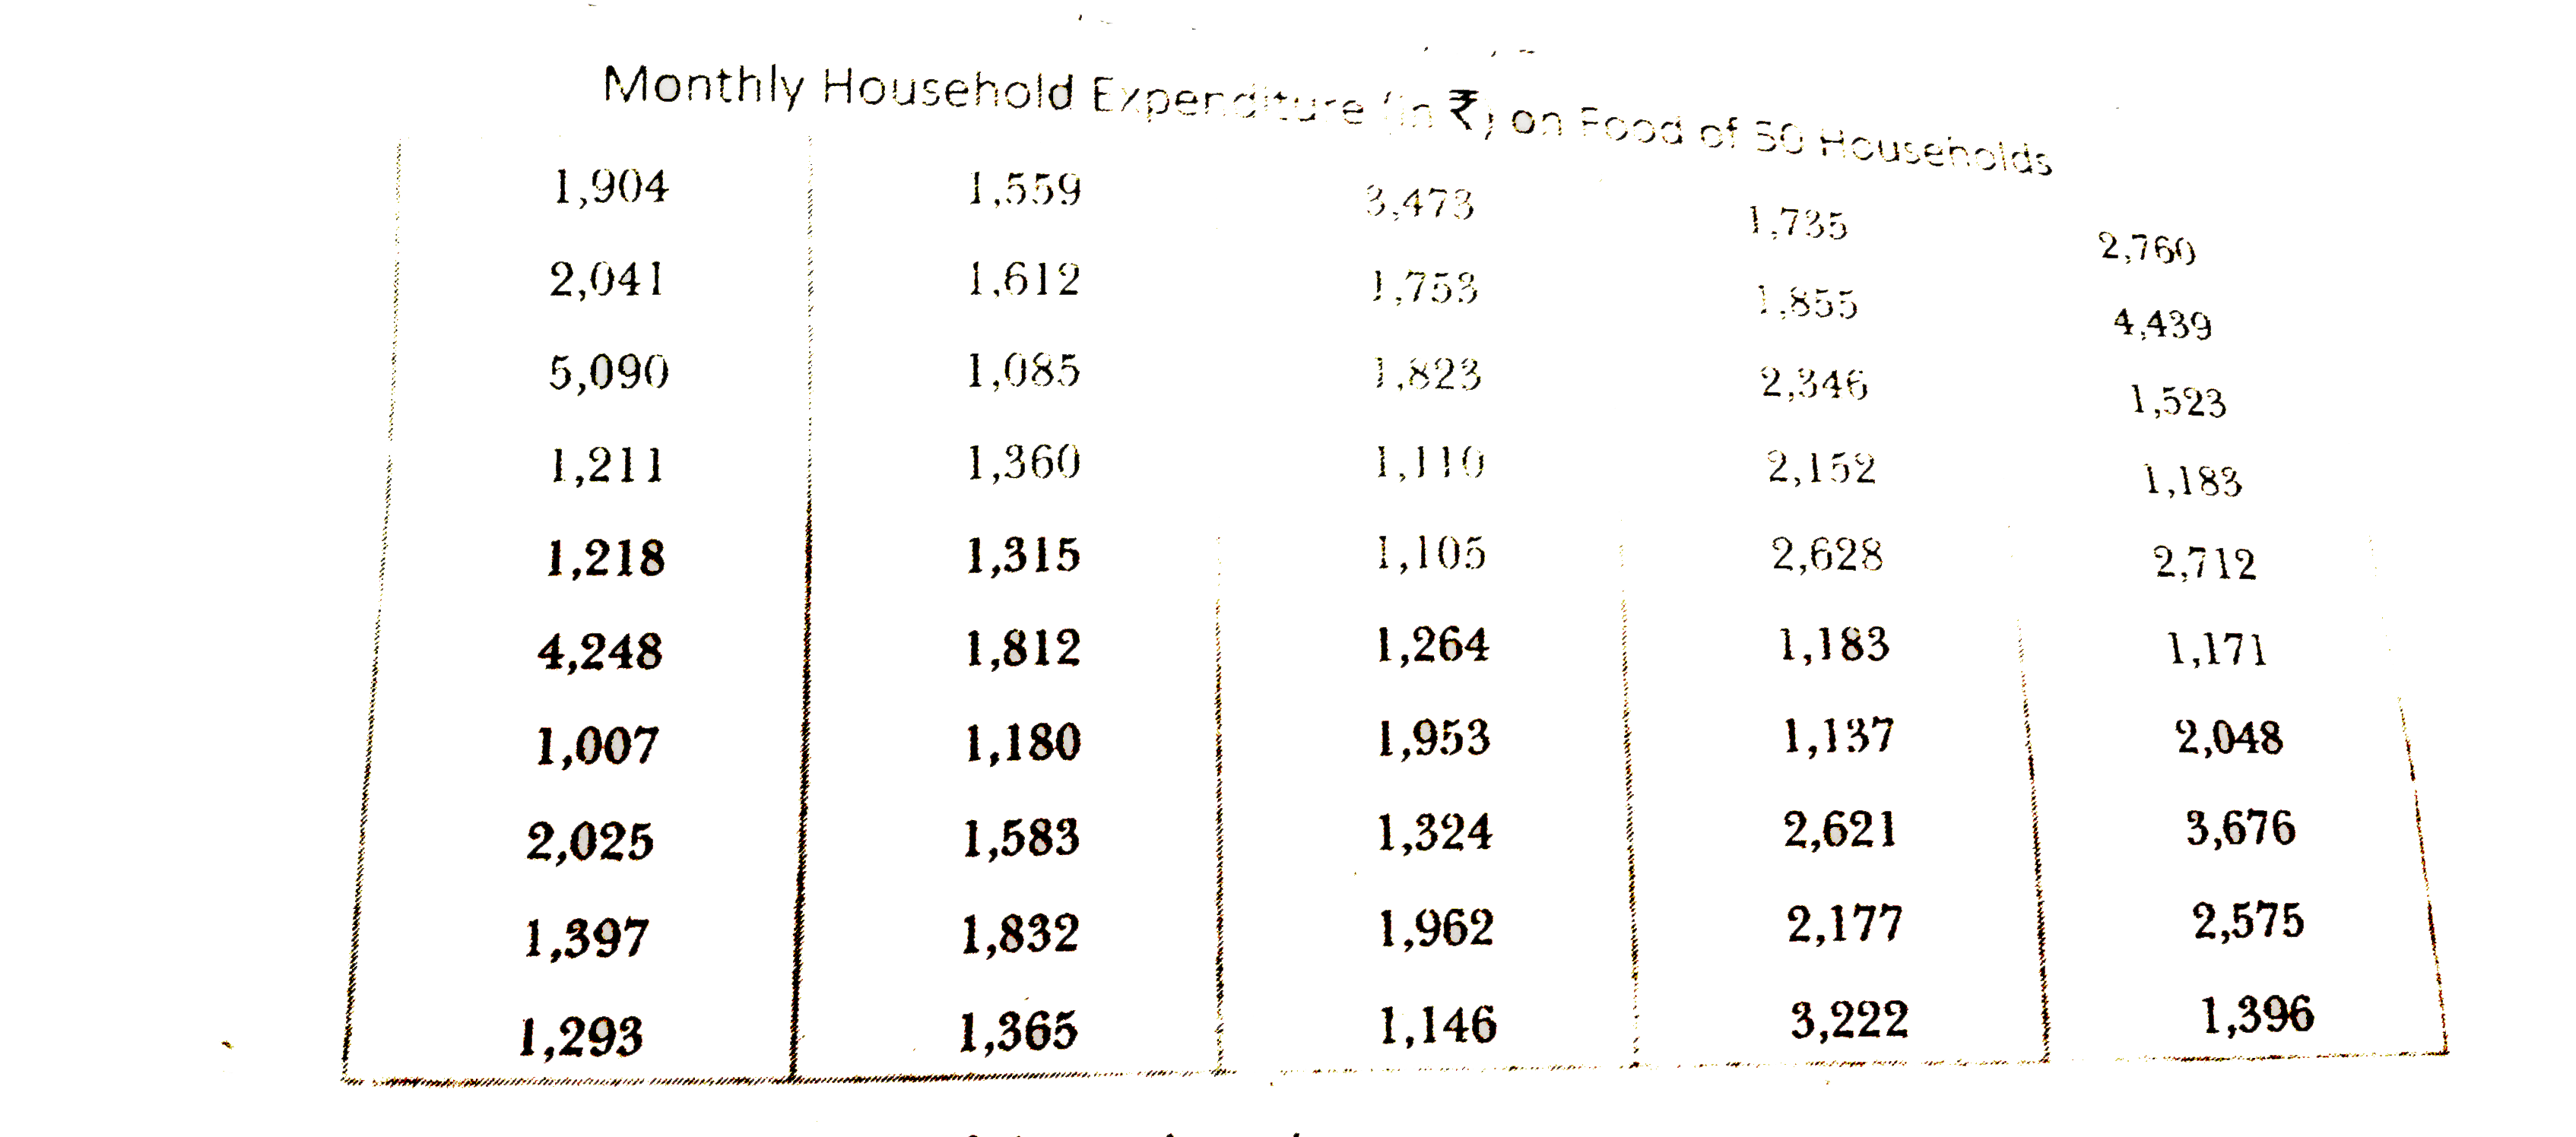
View SolutionUse the data in following table that relate to monthly household expenditure (in Rs.) on food of 50 households, and
(i) Obtain the range of monthly household expenditure on food.
(ii) Divide the range into appropriate number of class intervals and obtain the frequency distribution of expenditure.
(iii) Find the number of households whose monthly expenditure on food is
(a) less than Rs. 2,000, (b) more than Rs. 3,000, (c) between Rs. 1,500 and Rs. 500.
View SolutionA company selected 4000 households at random and surveyed them to find out a relationship between income level and the number of televisions sets in a home. The information, so obtained is listed in the following table.
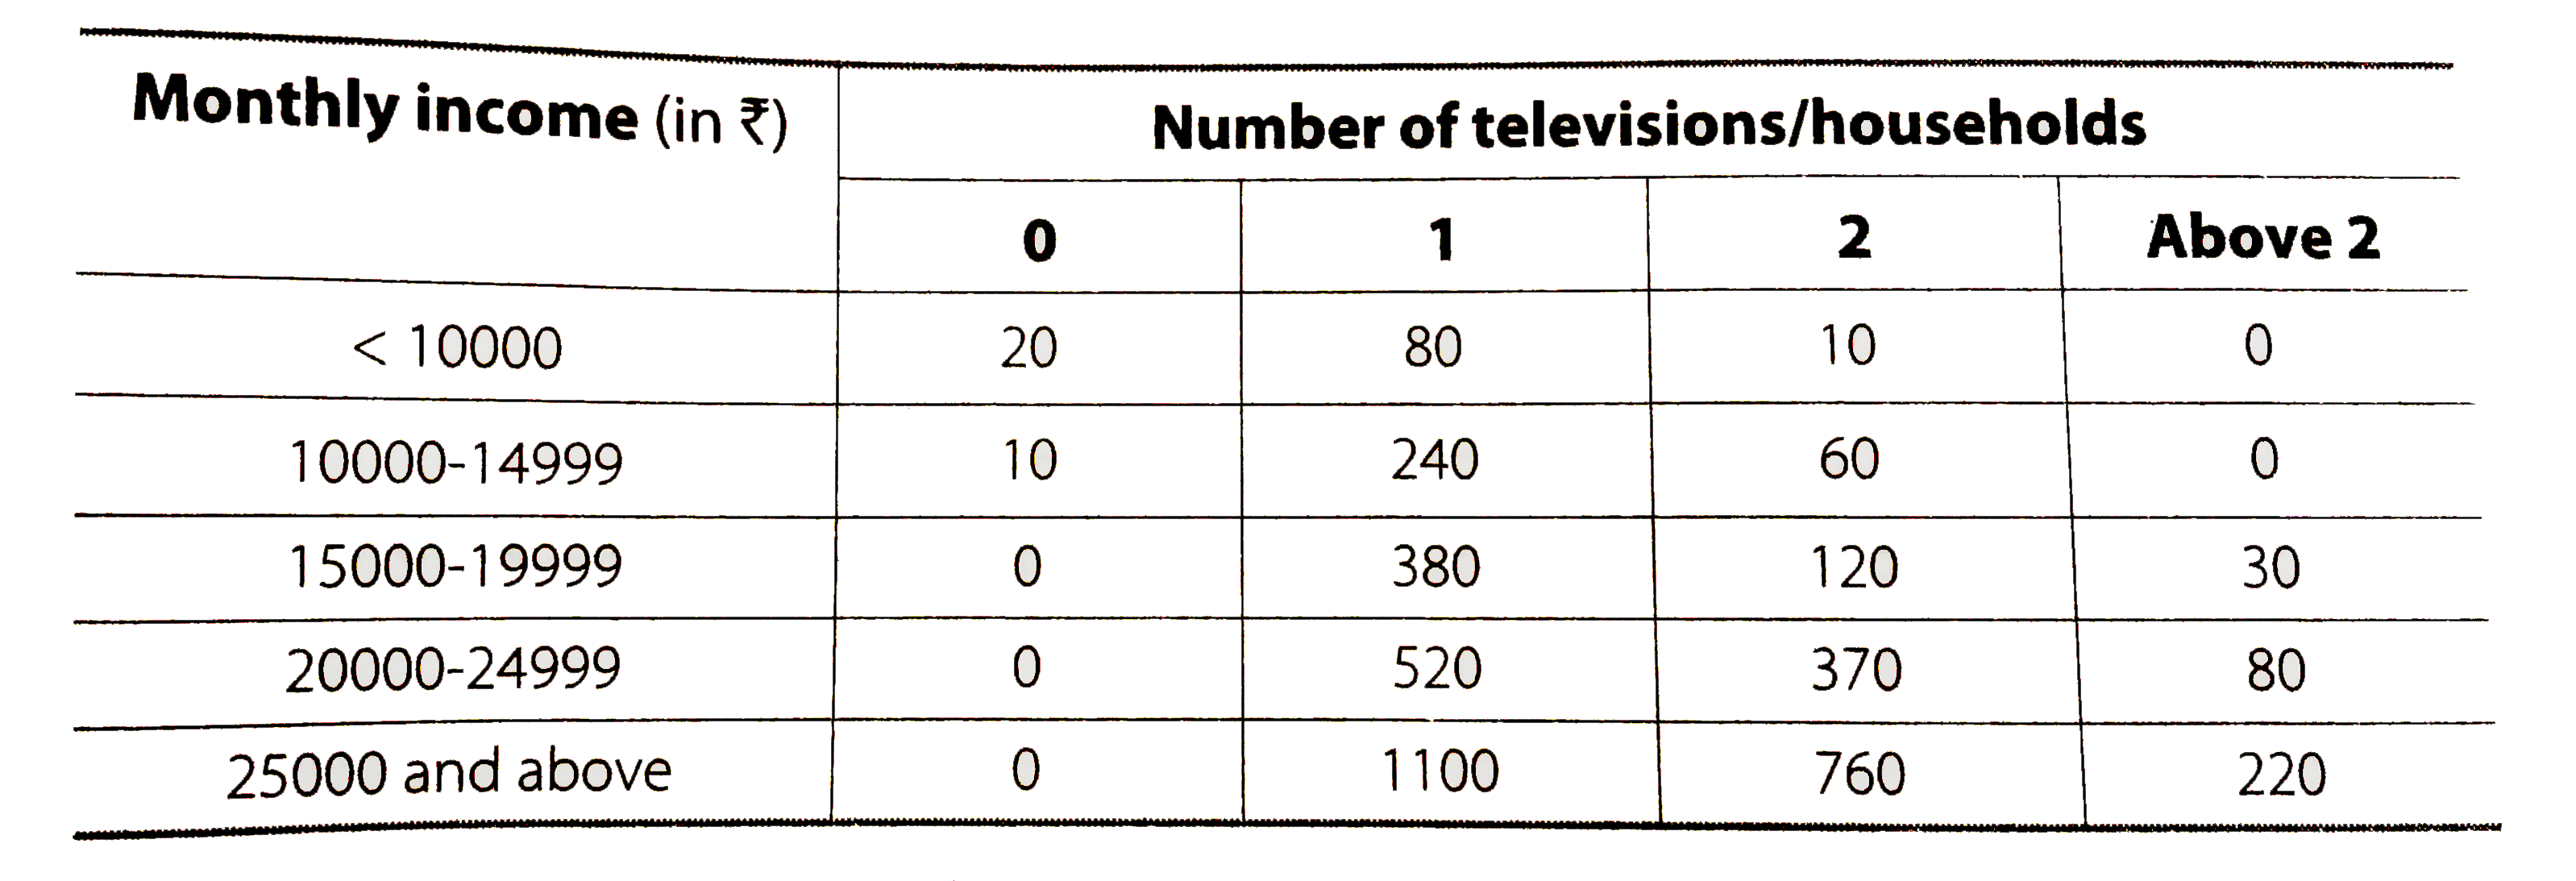
Find the probability
i) of a household earning Rs 10000- Rs 14999 per year and having exactly one television.
ii) of a household earning Rs 25000 and more per year owning 2 televisions.
iii) of a household not having any television.
View Solution
