The following is the distance -time graph of Amit's walking.
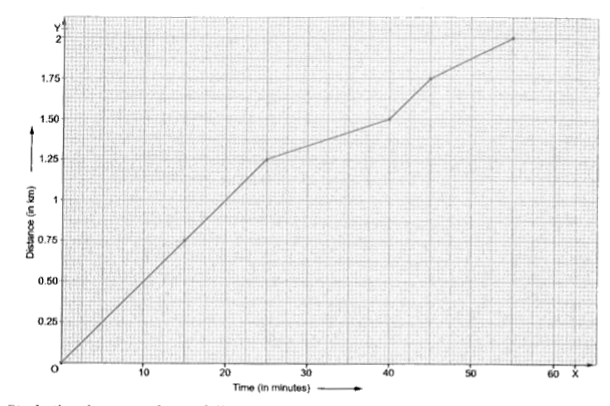
Study the above graph carefully and answer the questions given below :
(i) When does Amit make the least progress ? Explain your answer.
(ii) Find his average speed in km/hr.
The correct Answer is:(i)25 min to 40 min
Step by step video, text & image solution for The following is the distance -time graph of Amit's walking. Study the above graph carefully and answer the questions given below : (i) When does Amit make the least progress ? Explain your answer. (ii) Find his average speed in km/hr. by Maths experts to help you in doubts & scoring excellent marks in Class 8 exams.
Topper's Solved these Questions
- BOOK - RS AGGARWALCHAPTER - LINE GRAPHS AND LINEAR GRAPHSEXERCISE - Exercise 2325videos
LINE GRAPHS AND LINEAR GRAPHS
- BOOK - RS AGGARWALCHAPTER - INTRODUCTION TO COORDINATE GEOMETRYEXERCISE - EXERCISE B (OBJECTIVE QUESTIONS)7videos
INTRODUCTION TO COORDINATE GEOMETRY
- BOOK - RS AGGARWALCHAPTER - LINEAR EQUATIONSEXERCISE - TEST PAPER-8 (D) (Write .T. for true and .F. for false for each of the following:)1videos
LINEAR EQUATIONS
Similar Questions
The following is the time-distance graph of Sneha’s walking.
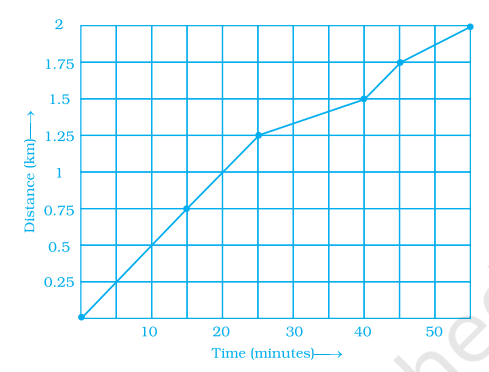
(a) When does Sneha make the least progress? Explain your reasoning.
(b) Find her average speed in km/hour.View SolutionRead the following graph carefully and answer the questions given below:
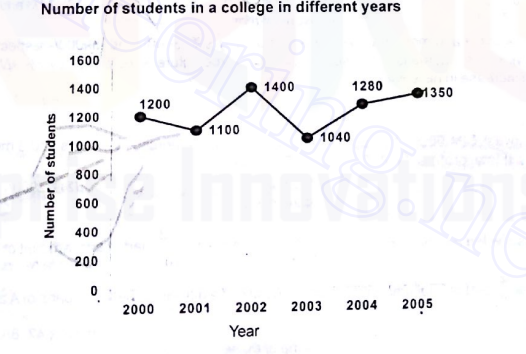
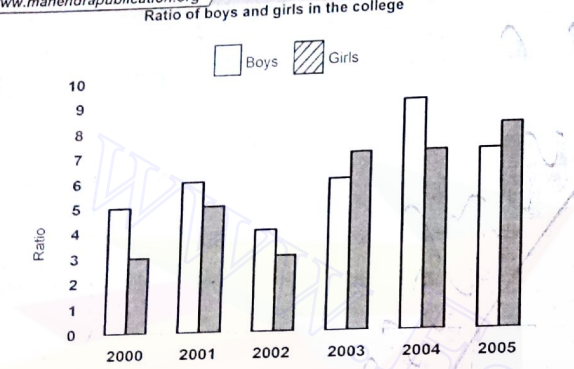
What is the average number of girls in all the years?View Solution
Knowledge Check
- Question 1 - Select One
Study the graph carefully and answer the following questions.
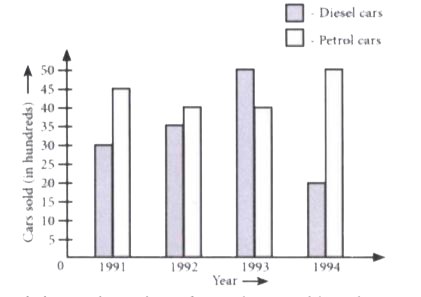
Find the mean sale of Petrol cars.A4735B5745C5740D4375 - Question 2 - Select One
Study the following graph carefully and answer the question given below-----
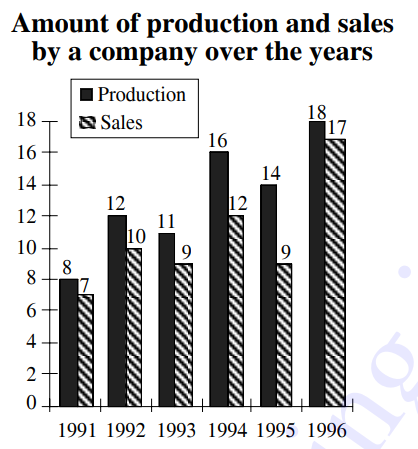
What was the difference between the sales of 1992 and 1995 ?A10 lakh tonnesB50 thousand tonnesC1 lakh tonnesD75 thousand tonnes - Question 3 - Select One
The following bar graph shows the games played by the students. Study the graph carefully and answer the question given below:
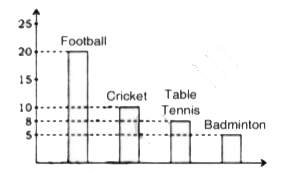
How many students play table tennis?A10B8C18D20
The following distance-time graph is for a car travelling to certain places.
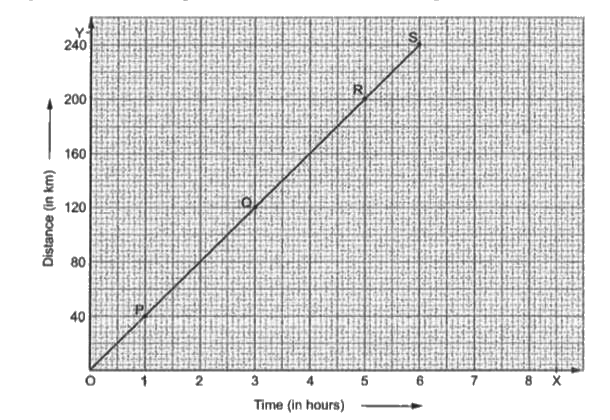
Study the above distance-time graph carefully and answer the questions given below :
(i) How far does the car travel in 412 hours ?
(ii) Hou much time does the car take to reach R ?
(iii) How long does the car take to cover 80km?
(iv) How far is Q from the starting point ?
(v) When does the car reach the place S after starting ?View SolutionExamine the following graph carefully and answer the questions given below it :
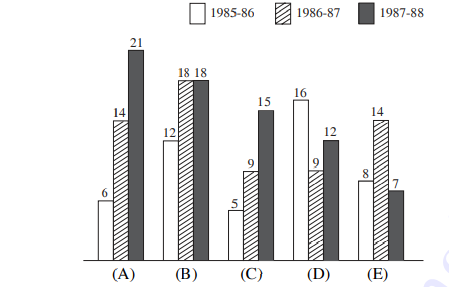
Which of the following statements is false ?View SolutionStudy the following graph carefully and answer the questions given below it -----
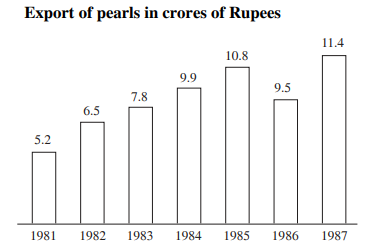
In how many years was the export above the average for the given period ?View SolutionStudy the following graph carefully and answer the questions given below it -----
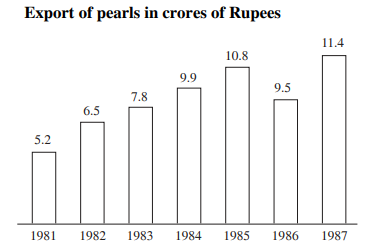
What was the percentage increase in export from 1986 to 1987 ?View SolutionStudy the following graph carefully and answer the question given below-----
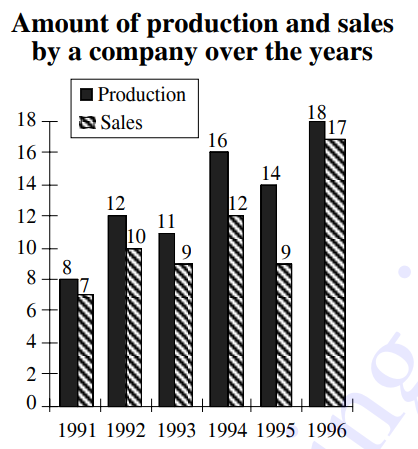
What was the percentage drop in sales from 1992 to 1993 ?View Solution

