The number of students in two sections A and B having different heights is shown in the table given below : Height (in metres) Numbers of students Section A Section B 1.55 3 2 1.60 7 6 1.62 12 14 1.65 15 14 1.68 8 9 1.71 6 9 1.7 3 4 The ratio of the number of students of a par4ticular height in section A to that in section B is the maximum for the height of 1.55m b. 1.60m c. 1.65m d. 1.71m
To solve the problem of finding the maximum ratio of the number of students in section A to section B for the given heights, we will follow these steps:
Step 1: Write down the data from the table.
We have the following heights and the corresponding number of students in sections A and B:
| Height (m) | Students in Section A | Students in Section B |
|------------|-----------------------|-----------------------|
| 1.55 | 3 | 2 |
| 1.60 | 7 | 6 |
| 1.62 | 12 | 14 |
| 1.65 | 15 | 14 |
| 1.68 | 8 | 9 |
| 1.71 | 6 | 9 |
| 1.70 | 3 | 4 |
Step 2: Calculate the ratios for each height.
We will compute the ratio of the number of students in section A to the number of students in section B for each height.
1. For height 1.55 m:
Ratio=32=1.5
2. For height 1.60 m:
Ratio=76≈1.167
3. For height 1.62 m:
Ratio=1214≈0.857
4. For height 1.65 m:
Ratio=1514≈1.071
5. For height 1.68 m:
Ratio=89≈0.889
6. For height 1.71 m:
Ratio=69=23≈0.667
7. For height 1.70 m:
Ratio=34=0.75
Step 3: Compare the ratios.
Now we will compare all the calculated ratios:
- 1.55 m: 1.5
- 1.60 m: 1.167
- 1.62 m: 0.857
- 1.65 m: 1.071
- 1.68 m: 0.889
- 1.71 m: 0.667
- 1.70 m: 0.75
Step 4: Identify the maximum ratio.
From the calculated ratios, the maximum ratio is:
- 1.5 (for height 1.55 m)
Conclusion:
The ratio of the number of students of a particular height in section A to that in section B is the maximum for the height of 1.55 m.
We have the following heights and the corresponding number of students in sections A and B:
|------------|-----------------------|-----------------------|
| 1.55 | 3 | 2 |
| 1.60 | 7 | 6 |
| 1.62 | 12 | 14 |
| 1.65 | 15 | 14 |
| 1.68 | 8 | 9 |
| 1.71 | 6 | 9 |
| 1.70 | 3 | 4 |
We will compute the ratio of the number of students in section A to the number of students in section B for each height.
Ratio=32=1.5
Ratio=76≈1.167
Ratio=1214≈0.857
Ratio=1514≈1.071
Ratio=89≈0.889
Ratio=69=23≈0.667
Ratio=34=0.75
Now we will compare all the calculated ratios:
- 1.55 m: 1.5
- 1.60 m: 1.167
- 1.62 m: 0.857
- 1.65 m: 1.071
- 1.68 m: 0.889
- 1.71 m: 0.667
- 1.70 m: 0.75
From the calculated ratios, the maximum ratio is:
- 1.5 (for height 1.55 m)
The ratio of the number of students of a particular height in section A to that in section B is the maximum for the height of 1.55 m.
Topper's Solved these Questions
Similar Questions
The pie chart given below shows the number of students in 6 different sections. The total number of students is 1800.
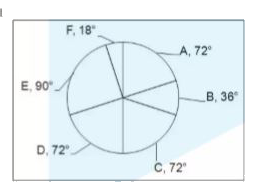
What is the total number of students in section E, C and F?
View SolutionThe pie chart given below shows the number of students in 6 different sections. The total number of students is 1800.
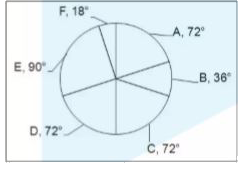
What is the ratio of number of students in section D to the number of students in section F and B?
View Solution
Knowledge Check
In a school, the number of students in each section is equal to the number of sections. If the total number of students is 625, then find the numbr of sections
A10B20C15D25The pie chart given below shows the number of students in 5 sections .The number of students is 7200.
What is the difference between the number of students in section C and section D?
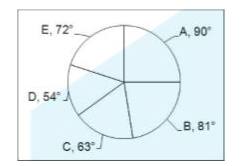 Aa)86Bb)180Cc)196Dd)42
The pie chart given below shows the number of students in 5 sections .The number of students is 7200.
The number of students in section A is what percent of that of section B?
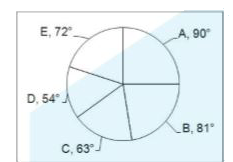 Aa)90Bb)110Cc)109Dd)111.11
The pie chart given below shows the number of students in 6 different sections. The total number of students is 1800.
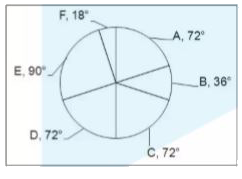
What is the difference between the number of students in section F to the number of students in section C?
View SolutionThe pie chart given below sows the number of students in 6 different sections. The total number of students is 1800.
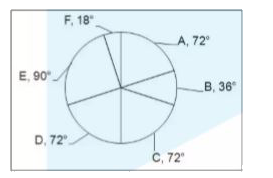
What is the average number of students in section A, B and F?
View SolutionThe below table gives the details of the number of students in Class 10, section A and B who had taken mid-term and final exam. What is the total number of students in both, section A and B?
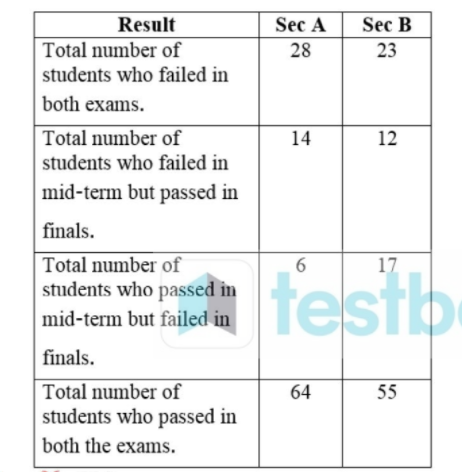
View SolutionThe pie chart given below shows the number of students in 5 sections .The number of students is 7200.
What is the average number of students of the 2 smallest sections?
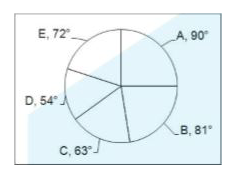
View SolutionThe pie chart given below shows the number of students in 5 sections .The number of students is 7200.
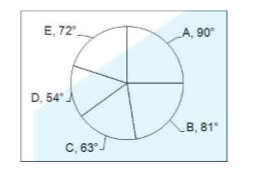
What is the total number of students in section E and section B?
View Solution
