अपशिष्ट उत्पादन तथा निवारण
Step by step video & image solution for अपशिष्ट उत्पादन तथा निवारण by Science experts to help you in doubts & scoring excellent marks in Class 10 exams.
Updated on:21/07/2023Similar Questions
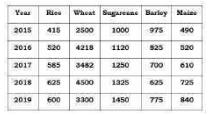
In the following table, the production of various crops (in tonnes) is given from 2015 to 2019. Study the table and answer the question that follows:
दी गयी तालिका में, 2015 से 2019 तक विभिन्न फसलों का उत्पादन (टन में ) दिया गया है | इस तालिका का अध्ययन करें तथा फिर पूछे गए प्रश्न का उत्तर दीजिए | The difference (in tonnes) between the average production of barley and average production of rice is:
जौ के औसत उत्पादन तथा चावल के औसत उत्पादन के बीच क्या अंतर (टन में ) है?
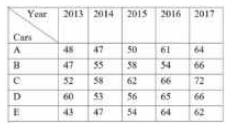
View SolutionThe table shows the production of different types of cars (in thousands).
 The total production of type C cars in 2015 and type E cars in 2018 taken together is what percent of the total production of cars in 2014 and 2017 taken together?
2015 में C तथा 2018 में E प्रकार की कारों का कुल उत्पादन एक साथ 2014 तथा 2017 में कारों के कुल उत्पादन का कितना प्रतिशत है ?
View Solution
Knowledge Check
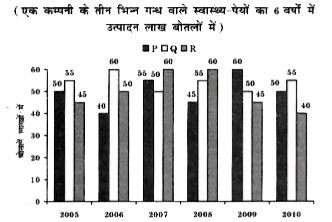
What is the difference between the average production of flavour Q in 2008, 2009 and 2010 from that of flavour P in 2005, 2006 and 2007 in lakh bottles?
वर्ष 2008, 2009 तथा 2010 में गन्ध के औसत उत्पादन तथा वर्ष 2005, 2006 तथा 2007 में गन्ध P के औसत उत्पादन का अन्तर कितनी बोतलों का रहा है?
 A5.5 lakh/ 5.5 लाखB5 lakh/ 5 लाखC50 lakh/50 लाखD0.5 lakh/0.5 लाख
मोटरगाडियों के अपशिष्ट का सबसे खतरनाक धातु प्रदूषक है:
Aमर्करीBटिनCकैडमियमDलेडमौन वाचन का मूल्यांकन किस परीक्षा के द्वारा किया जा सकता है?
Aचित्र दिखाकरBवस्तु को प्रत्यक्ष दिखाकरCमॉडल दिखाकरDउपर्युक्त सभी
The table shows the production of different types of cars (in thousands).
यह तालिका एक कंपनी द्वारा अलग-अलग कारों के उत्पादन (हज़ार में ) को दर्शाती है | The total production of type A cars in 2016 and type E cars in 2014 taken together is what percent of the total production of type C cars during 2014 to 2018?
2016 में A प्रकार तथा 2014 में E प्रकार की कारों का कुल उत्पादन संयुक्त रूप से 2014 से 2018 के दौरान C प्रकार की कारों के कुल उत्पादन का कितना प्रतिशत है ?
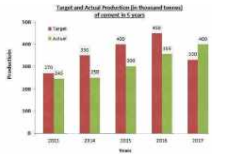
View SolutionThe bar graph given below shows the target and actual production of cement ( in thousand tons ) during 2013-2017. The ratio of the target production in 2014 and 2016 to the actual total production in 2013, 2016 and 2017 is :
नीचे दिया गया दंड आरेख 2013-2017 के दौरान सीमेंट के लक्षित और वास्तविक उत्पादन (हजार टन में) को दर्शाता है |
वर्ष 2014 और 2016 में सीमेंट के कुल लक्षित उत्पादन और 2013, 2016 तथा 2017 में कुल वास्तविक उत्पादन का अनुपात है :
View Solutionखनिज तथा ऊर्जा उत्पादन |खनिज कहाँ पाए जाते है |खनिजो का वर्गीकरण
View Solutionगाँव के बारे में |उत्पादन |उत्पादन करने के लिए आवश्यक तत्व |श्रम|Revision
View SolutionThe table shows the production of different types of cars (in thousands).
यह तालिका एक कंपनी द्वारा अलग-अलग कारों के उत्पादन ( हज़ार में ) को दर्शाती है | The total production of type B cars in 2015 and type C cars in 2013 is what percent more than the total production of type E cars in 2013 and 2014 ? (Correct to one decimal place)
2015 में B प्रकार तथा 2013 में प्रकार की कारों का कुल उत्पादन 2013 तथा 2014 में E प्रकार की कारों के कुल उत्पादन से कितना प्रतिशत अधिक है ? (एक दशमलव स्थान तक)
View Solution
