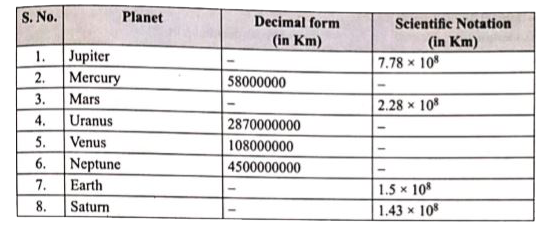
The following list shows the mean distance of the plants of the solar system from the Sun. Complete the following table. Then arrange in order of magnitude starting with the distance of the planet closest to the Sun.  Solution in Tamil
Step by step video & image solution for The following list shows the mean distance of the plants of the solar system from the Sun. Complete the following table. Then arrange in order of magnitude starting with the distance of the planet closest to the Sun. by Maths experts to help you in doubts & scoring excellent marks in Class 9 exams.
Updated on:21/07/2023Topper's Solved these Questions
- REAL NUMBERSBOOK - FULL MARKSCHAPTER - REAL NUMBERSEXERCISE - Text Book Activity (Activity I:)
1 Videos
- PROBABILITYBOOK - FULL MARKSCHAPTER - PROBABILITYEXERCISE - Assignment (Answer the following questions)
5 Videos
- SET LANGUAGEBOOK - FULL MARKSCHAPTER - SET LANGUAGEEXERCISE - Assignment (III. Answer the following questions.)
15 Videos
Similar Questions
It is interesting to see this pattern? √4415=4√415and√5524=5√524 verify it. Can you frame 4 such new surds?
View Solution80 bulbs are selected at random from a lot and their life time (in hours) is recorded in the form of a frequency table given below.

Find the probability that bulbs selected randomly from the lot has life less than 900 hours.
View SolutionIn a class of 50 students, each of the students passed either in mathematics or in a science or in both 10 students passed in both and 28 passed in science. Find how many students passed in mathematics only.
View SolutionMatch the following lists:

View SolutionWhich of the following are correct chain isomers of butane ? (i)
View SolutionDetermine the point of symmetry of a regular hexagon.
View SolutionDtermine the images of the following figure about the given line :
View SolutionMatch the following Column A to Column B

View SolutionMatch the following Column A to Column B

View SolutionMatch the following Column A to Column B

View SolutionThe inequation represented by the graph given below is :
View SolutionThe inequation that best describes the graph given below is _________
View SolutionThe inequation that best describes the following graph is _________
View SolutionWhat is the distance OA for the square shown in figure :- ltimg src="https://d10lpgp6xz60nq.cloudfront.net/physics_images/ALN_PHY_R05_E01_015_Q01.png" width="80%"gt
View SolutionFind the magnitude of the resultant of shown forces :-
ltimg src="https://d10lpgp6xz60nq.cloudfront.net/physics_images/ALN_PHY_R02_E02_009_Q01.png" width="80%"gt
View Solution
