Indentify which ones are trapeziums and which are not.
 Solution in Tamil
Step by step video & image solution for Indentify which ones are trapeziums and which are not. by Maths experts to help you in doubts & scoring excellent marks in Class 9 exams.
Updated on:21/07/2023Topper's Solved these Questions
- GEOMETRYBOOK - FULL MARKSCHAPTER - GEOMETRYEXERCISE - Prograss check (True or False)
10 Videos
- GEOMETRYBOOK - FULL MARKSCHAPTER - GEOMETRYEXERCISE - Thinking corner
3 Videos
- GEOMETRYBOOK - FULL MARKSCHAPTER - GEOMETRYEXERCISE - Prograss check (Answer the following question
7 Videos
- COORDINATE GEOMETRYBOOK - FULL MARKSCHAPTER - COORDINATE GEOMETRYEXERCISE - TEXTBOOK ACTIVITY
2 Videos
- MENSURATION BOOK - FULL MARKSCHAPTER - MENSURATION EXERCISE - Assignment (II. Answer the following questions)
8 Videos
Similar Questions
Every chord of a circle contains exactly two points of the circle .
View SolutionDraw four congruent circles as shown. What do you infer ?
View SolutionAre the opposite angles of a rhombus equal ?
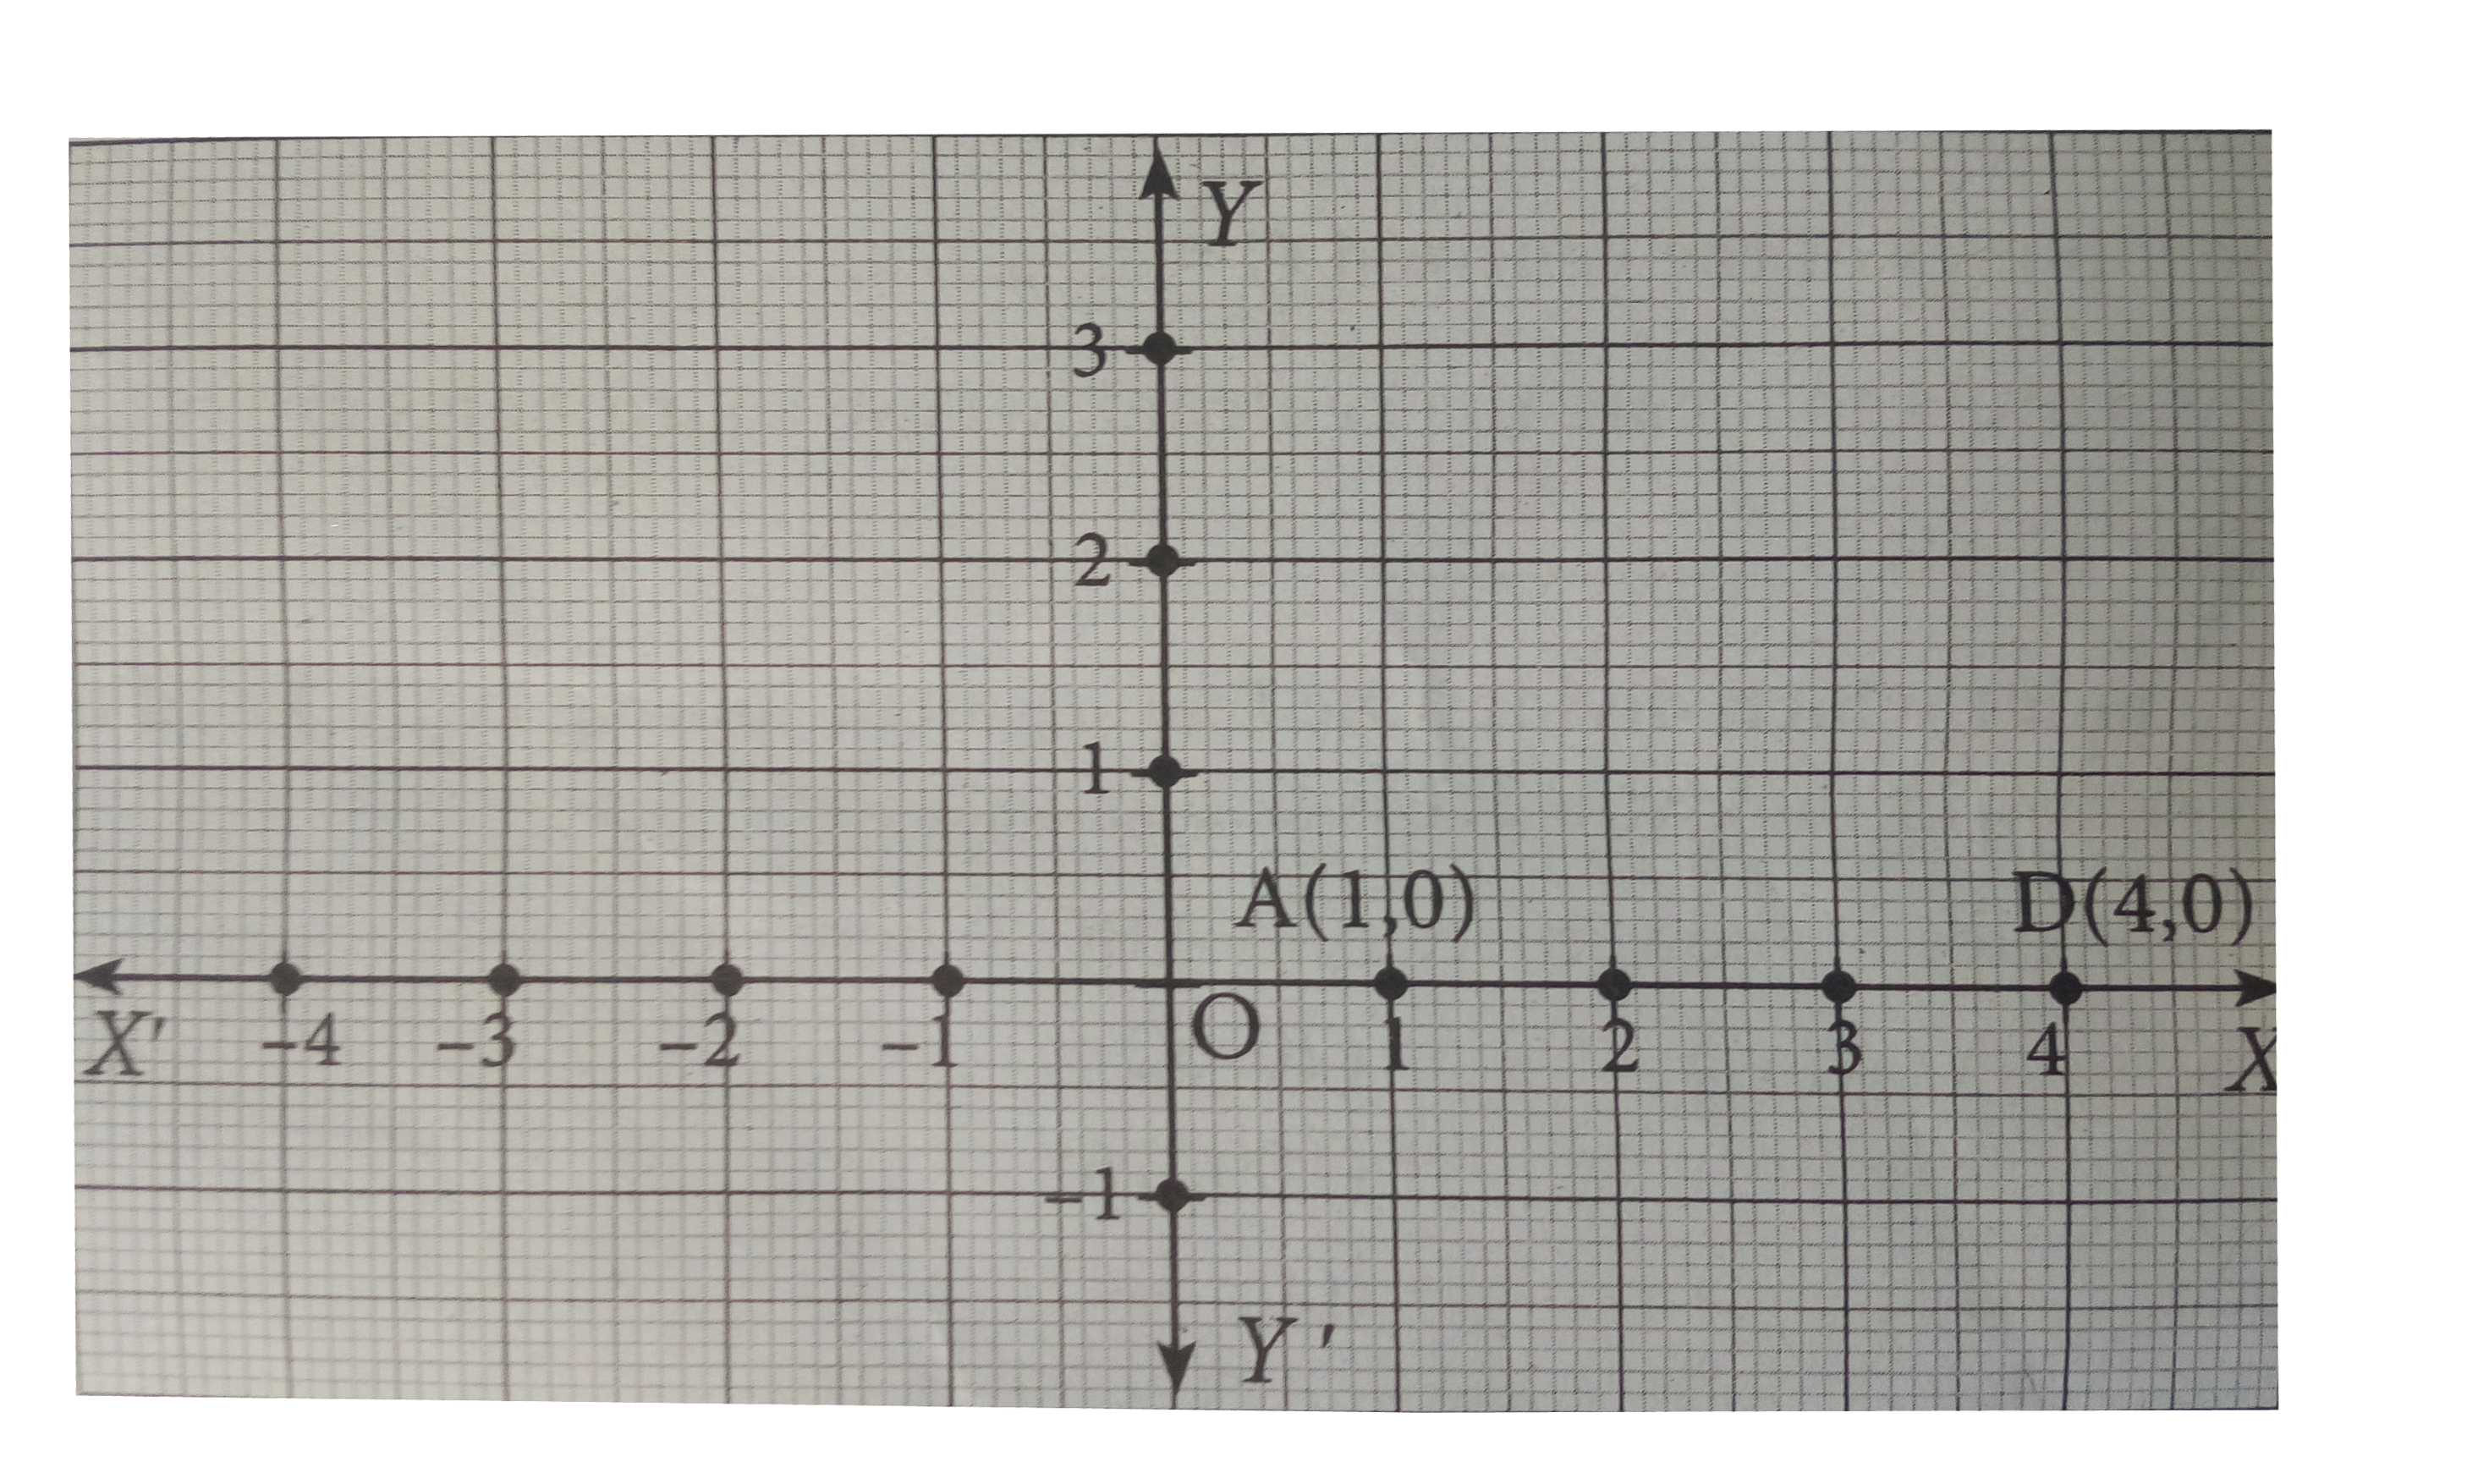
View SolutionPlot the following points on a graph sheet by taking the scale as 1cm=1 unit.
Find how far the points are from each other?
A(1,0) and D(4,0). Find AD and also DA.
Is AD=DA?
You plot another set of points and verify your Result.

View SolutionFind the area of a quadrilateral ABCD where AB = 7 cm, DA = 15 cm, AC = 9 cm, BC = 6 cm and CD = 12 cm.
View SolutionHow many lines of symmetry does the above figure have ?
View SolutionWhich of the following are correct chain isomers of butane ? (i)
View SolutionDetermine the point of symmetry of a regular hexagon.
View SolutionDtermine the images of the following figure about the given line :
View SolutionMatch the following Column A to Column B

View SolutionMatch the following Column A to Column B

View SolutionMatch the following Column A to Column B

View SolutionFind the area of the figure given below.

View SolutionThe area of the shaded part in the figure given below is ______.

View SolutionThe inequation represented by the graph given below is :
View SolutionThe inequation that best describes the graph given below is _________
View Solution
