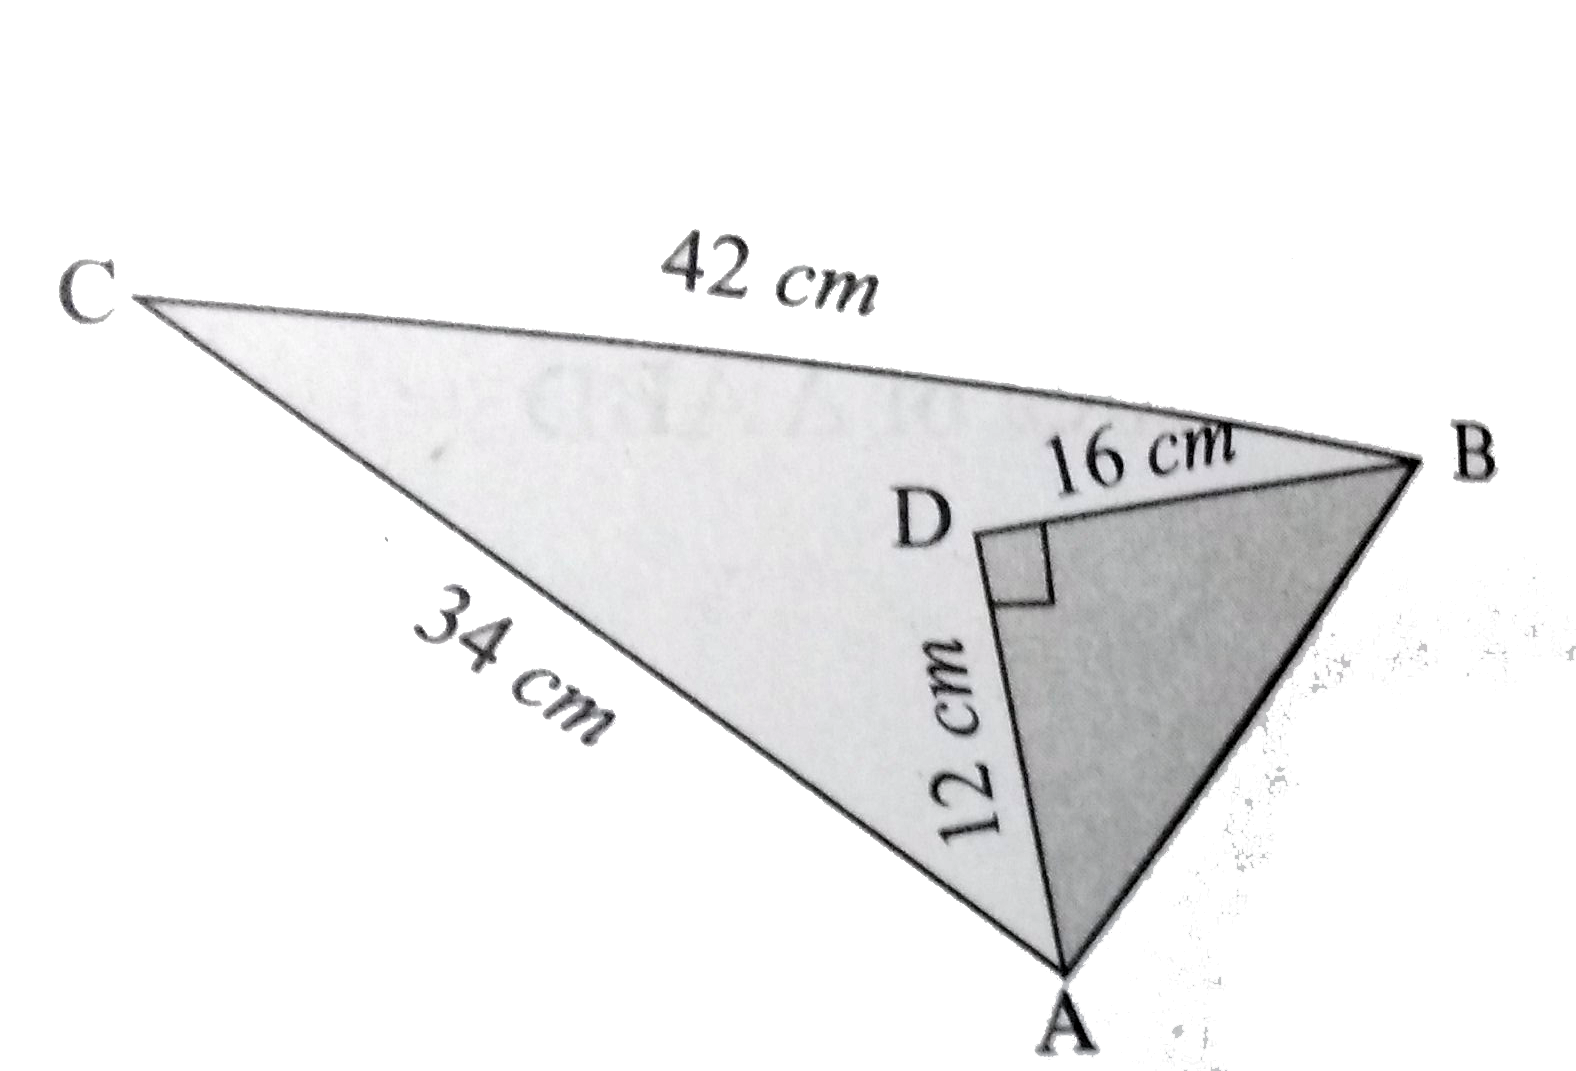
Find the area of the unshaded region.
 Solution in Tamil
The correct Answer is:240 cm2
Step by step video, text & image solution for Find the area of the unshaded region. by Maths experts to help you in doubts & scoring excellent marks in Class 9 exams.
Topper's Solved these Questions
- BOOK - FULL MARKSCHAPTER - MENSURATION EXERCISE - Exercise 7.27videos
MENSURATION
- BOOK - FULL MARKSCHAPTER - MENSURATION EXERCISE - Exercise 7.39videos
MENSURATION
- BOOK - FULL MARKSCHAPTER - GEOMETRYEXERCISE - Assignment (IV. Answer the following questions)9videos
GEOMETRY
- BOOK - FULL MARKSCHAPTER - PROBABILITYEXERCISE - Assignment (Answer the following questions)5videos
PROBABILITY
Similar Questions
Find the Total Surface Area and the Lateral Surface Area of a cuboil whose dimensions are length = 20 cm, breadth = 15 cm, height = 8 cm
02:11View SolutionFind the volume of a cuboid whose diamensions are
(i) lemgth = 12 cm, breadth = 8 cm, heght = 6 cm
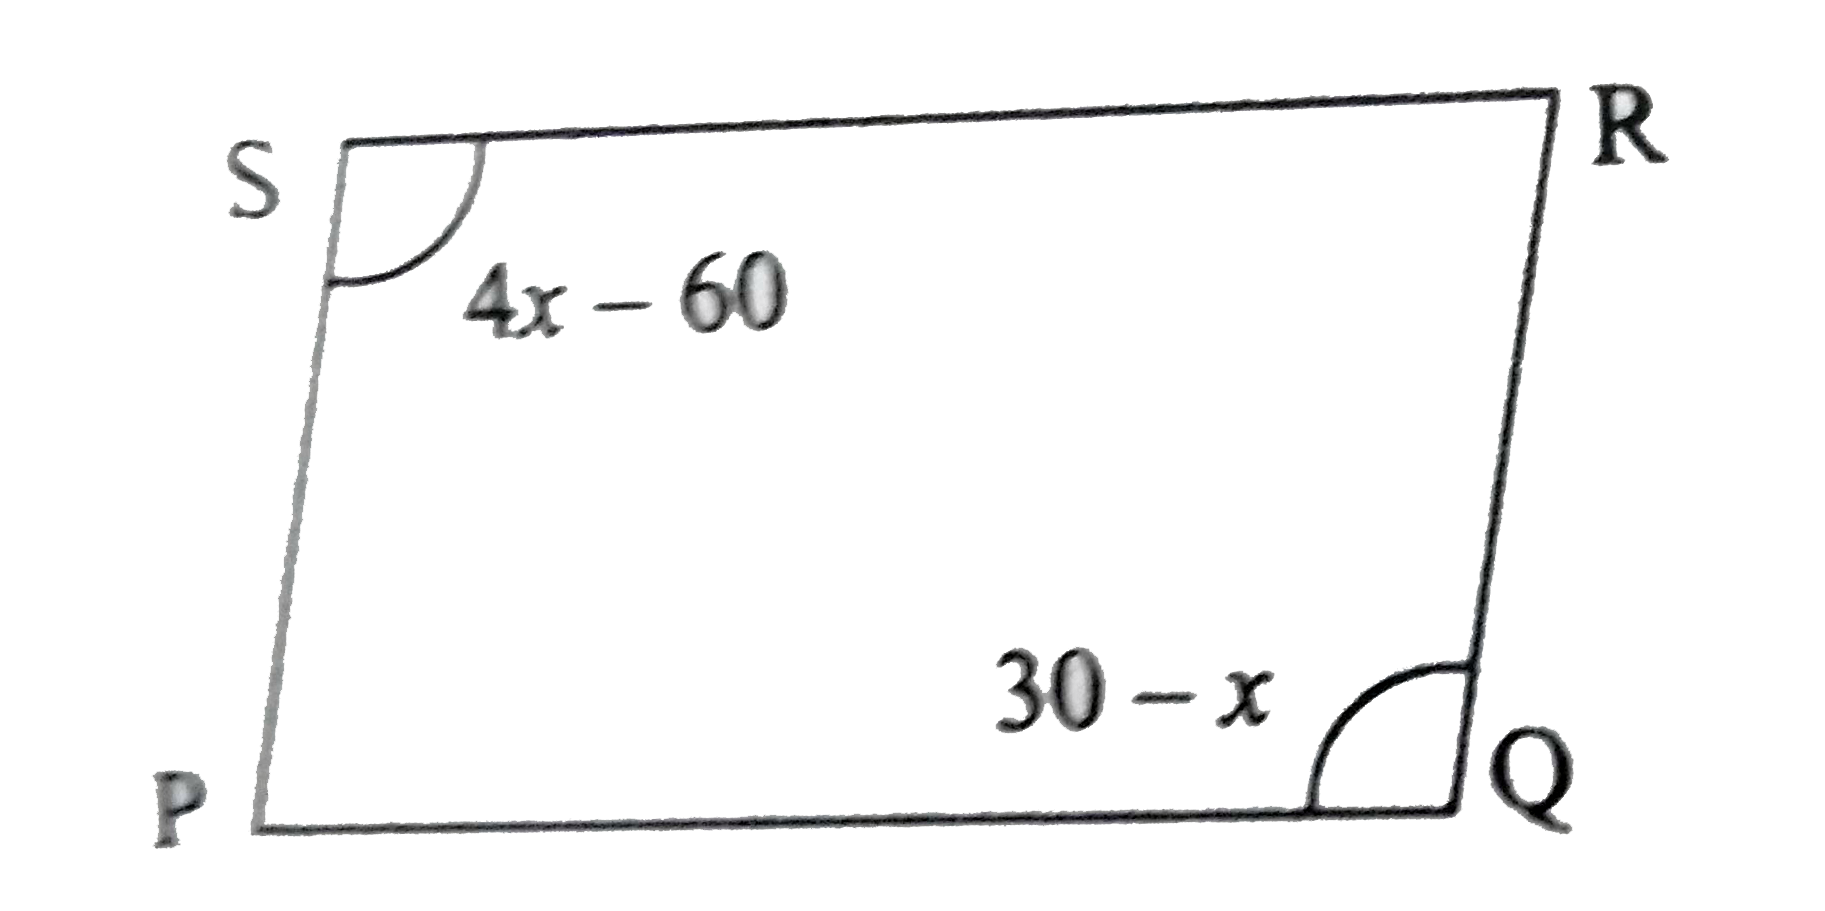
(ii) length = 60 m, breadth = 25 m, height = 1.5 m03:53View SolutionIn the given diagram PQRS is a parellelogram.
∠S=4x−60∠Q=30−x. Find the angles of P and R .
 02:45View Solution
80 bulbs are selected at random from a lot and their life time (in hours) is recorded in the form of a frequency table given below.

Find the probability that bulbs selected randomly from the lot has life less than 900 hours.02:17View SolutionDetermine the point of symmetry of a regular hexagon.
05:41View SolutionFind the area of the shaded region, given that the radius of each circle is equal to 5 cm.
03:28View SolutionMatch the following Column A to Column B
 02:21View Solution
Match the following Column A to Column B
 02:03View Solution
Match the following Column A to Column B
 02:10View Solution
Find the area of figure given below.
 02:17View Solution
Find the area of the figure given below.
 02:10View Solution
The area of the shaded part in the figure given below is ______.
 04:23View Solution
The inequation represented by the graph given below is :
01:13View SolutionThe inequation that best describes the graph given below is _________
04:05View SolutionThe inequation that best describes the following graph is _________
01:52View SolutionWhich inequations represent the shaded region in the given figure
03:10View Solution

