Suppose that five people are ill during the first week of an epidemic and each sick person spreads the contagious disease to four other people by the end of the second week and so on. By the end of 15th week, how many people will be affected by the epidemic?Solution in Tamil
The correct Answer is:53(415−1)
Step by step video, text & image solution for Suppose that five people are ill during the first week of an epidemic and each sick person spreads the contagious disease to four other people by the end of the second week and so on. By the end of 15th week, how many people will be affected by the epidemic? by Maths experts to help you in doubts & scoring excellent marks in Class 10 exams.
Topper's Solved these Questions
- BOOK - FULL MARKSCHAPTER - NUMBERS AND SEQUENCESEXERCISE - ADDITIONAL QUESTION SOLVED (III. ANSWER THE FOLLOWING).12videos
NUMBERS AND SEQUENCES
- BOOK - FULL MARKSCHAPTER - NUMBERS AND SEQUENCESEXERCISE - ADDITIONAL QUESTION SOLVED25videos
NUMBERS AND SEQUENCES
- BOOK - FULL MARKSCHAPTER - MENSURATION EXERCISE - ADDITIONAL QUESTIONS SOLVED (iii)8videos
MENSURATION
- BOOK - FULL MARKSCHAPTER - RELATIONS AND FUNCTIONS EXERCISE - ADDITIONAL QUESTIONS SOLVED (ANSWER THE FOLLOWING QUESTIONS)26videos
RELATIONS AND FUNCTIONS
Similar Questions
Use Euclid's division algorithim to find the HCF of 867 and 255.
04:38View SolutionThe sum of the exponents of the prime factors in the prime factorisation of 504 is ……………….
02:50View SolutionA vessel is in the form of a hemispherical bowl mounted by a hollow cylinder. The diameter is 14 cm and the height of the vessel is 13 cm. Find the capacity of the vessel.
01:35View SolutionIf A = {2,3,5} and B = {1,4} then find
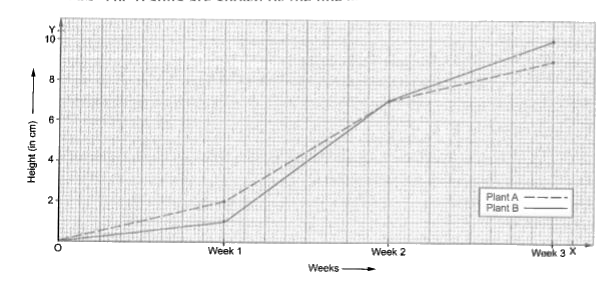
(i) A×B (ii) B×A07:11View SolutionFor an experiment in Botany, two different plants, plant A and plant B were grown under similar laboratory conditions. Their heights were measured at the end of each week for 3 weeks. The results are shown by the following graph.(a) How high was Plant A after (i) 2 weeks (ii) 3 weeks?(b) How high was Plant B after (i) 2 weeks (ii) 3 weeks?(c) How much did Plant A grow during the 3rd week?(d) How much did Plant B grow from the end of the 2nd week to the end of the 3rd week?(e) During which week did Plant A grow most?(f) During which week did Plant B grow least?(g) Were the two plants of the same height during any week shown here? Specify.
01:26View Solutionयदि 6 व्यक्ति 8 घंटे प्रतिदिन काम करके 8400 रूपये प्रति सपताह कमाते है तो 9 व्यक्ति 6 घंटे प्रतिदिन काम करके प्रतिदिन काम प्रति सप्ताह कितना कमाएंगे ?
06:58View Solutionयदि आप एक पंक्ति में एक छोर से 9 वे व्यकित है और दूसरे छोर से 11 वे , तो पंक्ति में कितने व्यक्ति है ?
01:43View SolutionFor an experiment in botany, two different plants, plant A and B, were grown under similar laboratory conditions. Their heights were measured at the end of each week for three weeks. The results are shown by the line graph given below :

Study the above line graph carefully and answer the questions given below:
(i) How high was plant A after (a)2 weeks (b)3 weeks ?
(ii) How high was plant B after (a)2 weeks (b)3 weeks?
(iii) How much did plant A grow during the 3rd week?
(iv) How much did plant B grow from the end of the 2nd week to the end of the 3rd week ?
(v) During which week did plant A grow most ?
(vi) During which week did plant B grow least ?
(vii) Were the two plants of the same height during any week shown here ? Specify.02:19View Solutionஒரு விருந்தில் 15 நபர்கள் உள்ளனர். எந்த இரு நபர்களும் தங்களுக்குள் கைகுலுக்கிக் கொள்கிறார்கள் எனக் கொண்டால், அந்த விருந்தில் எத்தனை கைகுலுக்கல் நிகழும்?
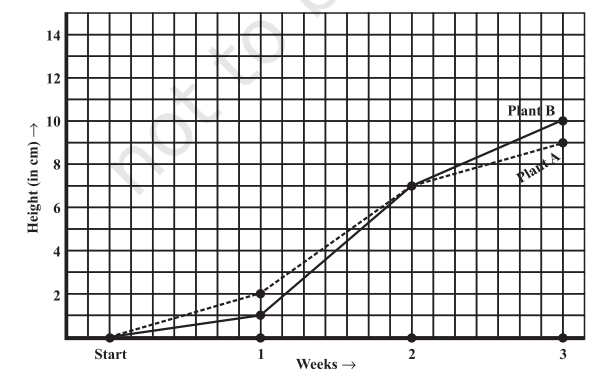
03:26View SolutionFor an experiment in Botany, two different plants, plant A and plant B were grown under similar laboratory conditions. Their heights were measured at the end of each week for 3 weeks. The results are shown by the following graph.(a) How high was Plant A after (i) 2 weeks (ii) 3 weeks?(b) How high was Plant B after (i) 2 weeks (ii) 3 weeks?(c) How much did Plant A grow during the 3rd week?(d) How much did Plant B grow from the end of the 2nd week to the end of the 3rd week?(e) During which week did Plant A grow most?(f) During which week did Plant B grow least?(g) Were the two plants of the same height during any week shown here? Specify.
 01:12View Solution
সংক্রামক মহামারিটি হল -
View Solutionনগনারায়ন বা শিল্পায়নের সময় অনেক লোক যখন একসঙ্গে ছোট জায়গায় থাকতে আরম্ভ করল, তখন কোন রোগটি মহামারীর আকার নিল?
02:29View SolutionFor an experiement in Botany, two different plants, plant A and plant B were grown under similar laboratory conditions. Their heigths were measured at the end of each week for 3 weeks. The results are shown by the following graph.

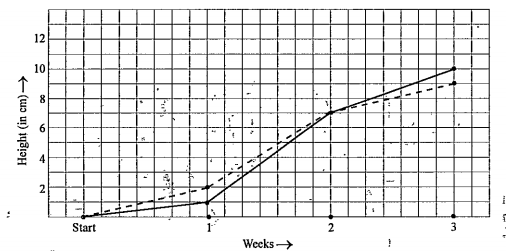
How much did Plant B grow from the end of the 2nd week to the end of the 3rd week?04:00View SolutionTwo plants A and B were raised in the conditions. Their heights were measured at the end of each week for three weeks. The results are shown in the following graph: How much did plant B grow in height from the second week to the end of the third week?
03:45View SolutionDo all diseases spread to people coming in contact with a sick person ?
View Solution

