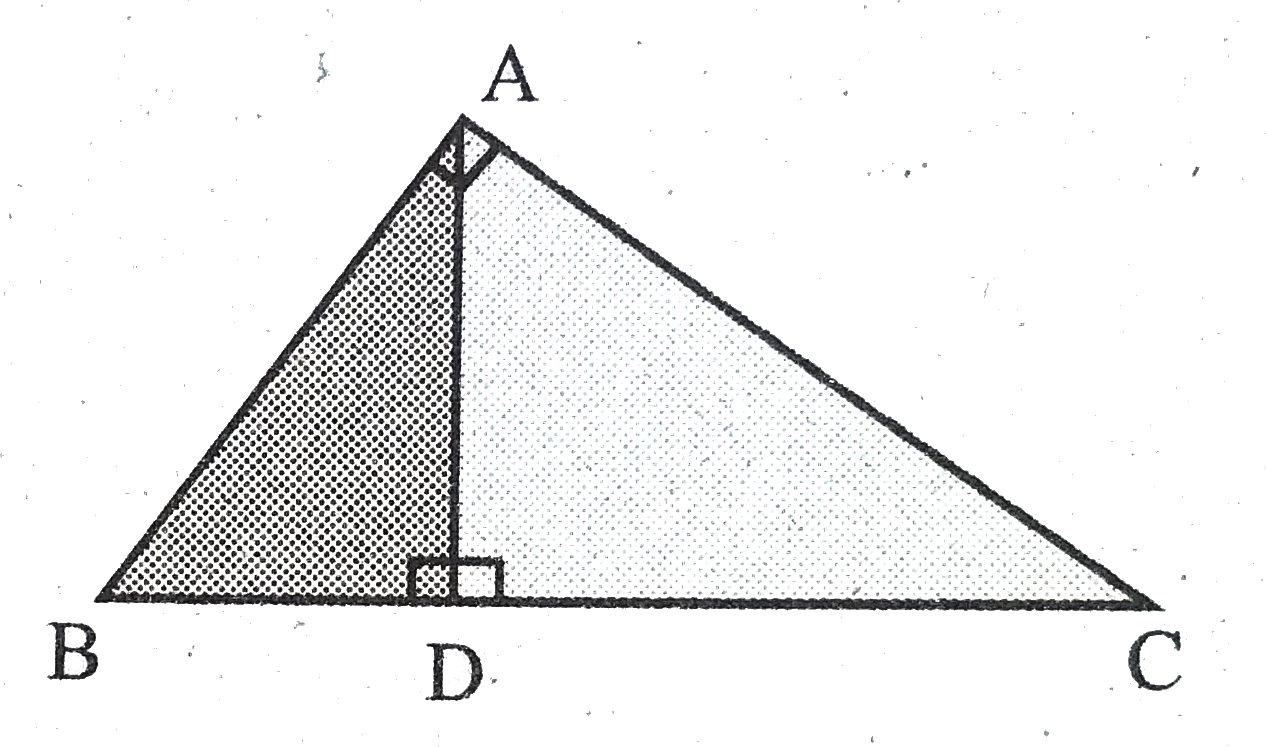
In the adjacent figure ∠BAC=90∘andAD⊥BC then
 Solution in Tamil
BD.CD=BC2
AB.AC=BC2
BD.CD=AD2
AB.AC=AD2
The correct Answer is:C
Step by step video, text & image solution for In the adjacent figure angle BAC=90^(@) and AD bot BC then by Maths experts to help you in doubts & scoring excellent marks in Class 10 exams.
Topper's Solved these Questions
- BOOK - FULL MARKSCHAPTER - GEOMETRYEXERCISE - UNIT EXERCISE 410videos
GEOMETRY
- BOOK - FULL MARKSCHAPTER - GEOMETRYEXERCISE - ADDITIONAL QUESTIONS SOLVED (MULTIPLE CHOICE QUESTIONS)23videos
GEOMETRY
- BOOK - FULL MARKSCHAPTER - GEOMETRYEXERCISE - EXERCISE 4.417videos
GEOMETRY
- BOOK - FULL MARKSCHAPTER - DEPARTMENTAL MODEL PAPER EXERCISE - PART-IV3videos
DEPARTMENTAL MODEL PAPER
- BOOK - FULL MARKSCHAPTER - MENSURATION EXERCISE - ADDITIONAL QUESTIONS SOLVED (iii)8videos
MENSURATION
Similar Questions
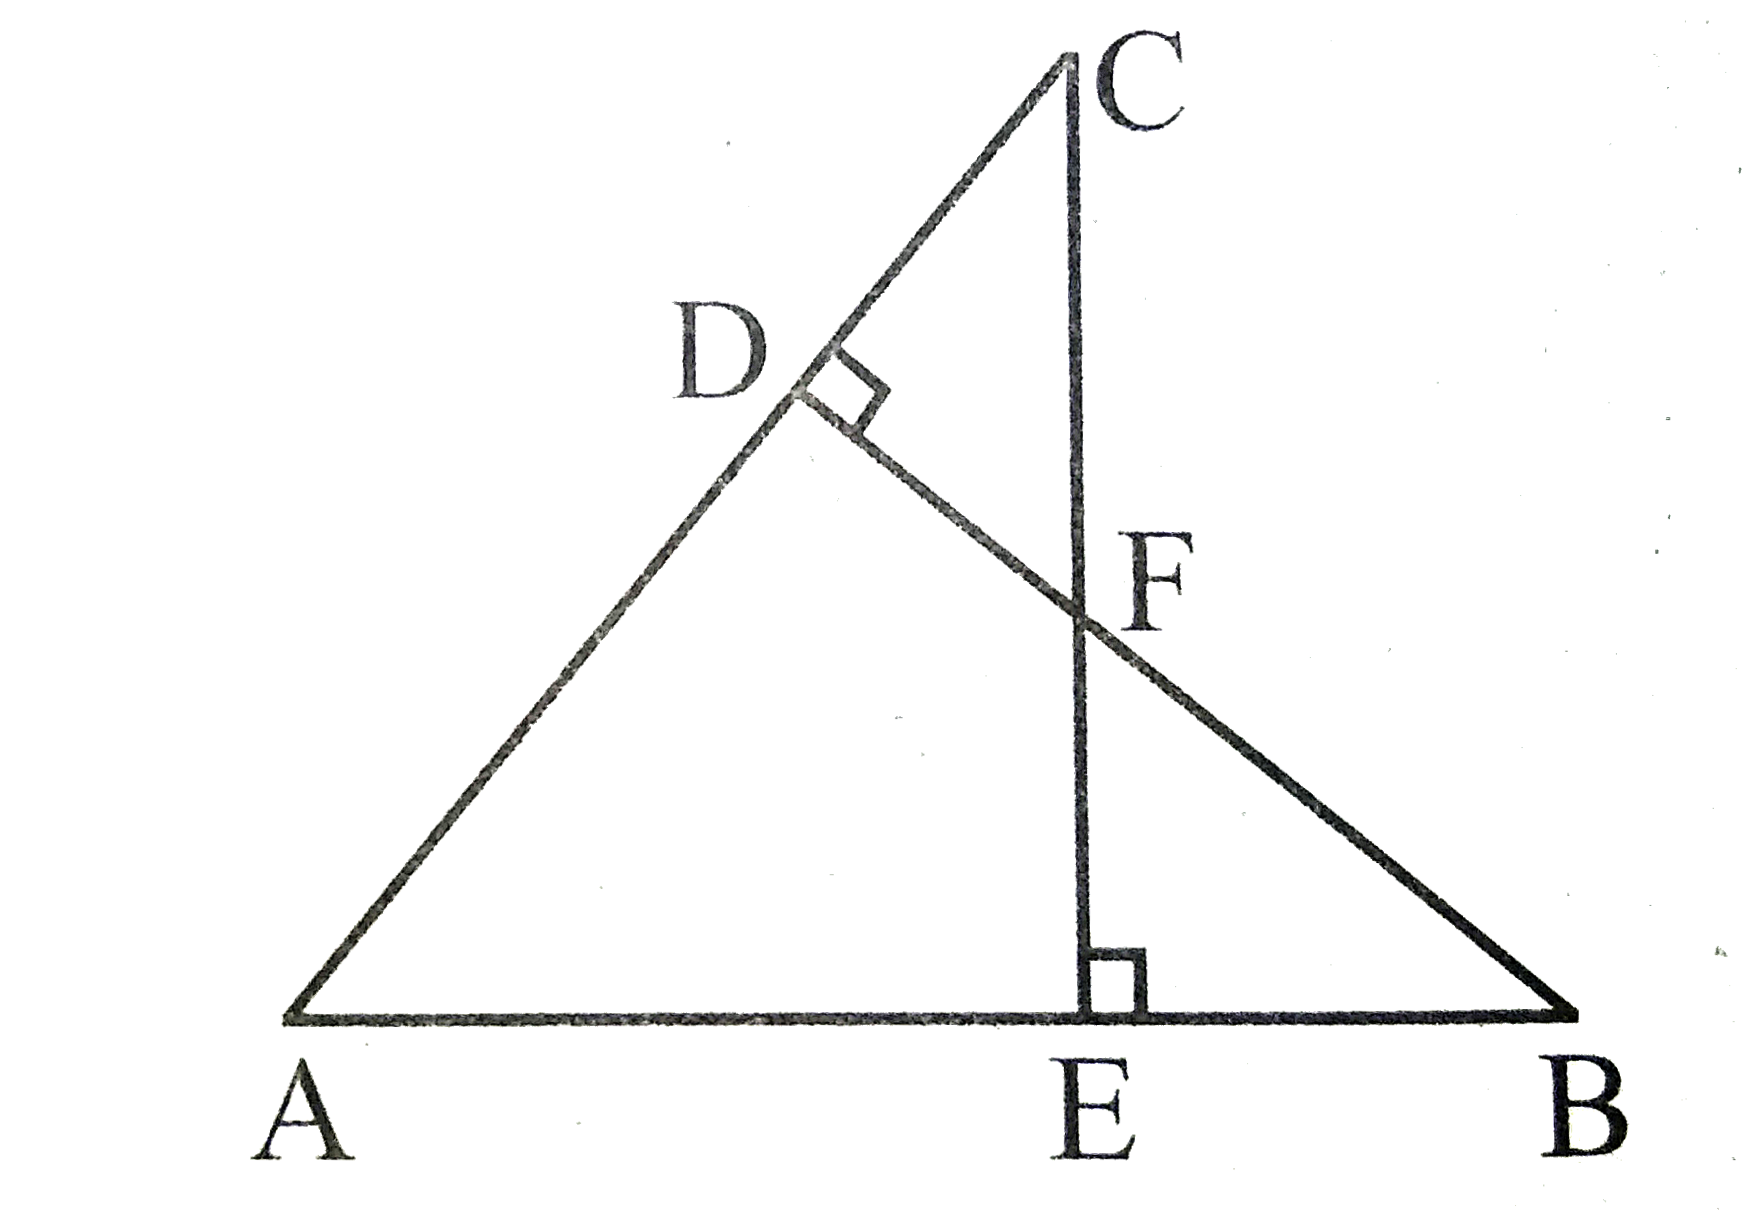
In the figure, if BD⊥ACandCE⊥AB , prove that
(i)ΔAEC~ΔADB (ii)CAAB=CEDB
 01:37View Solution
If a straight line intersects the sides AB and AC of a △ABC at D and E respectively and is parallel to BC , then AEAC= . ………..
02:11View SolutionThe length of the tangent to a circle from a point P, which is 25 cm away from the centre is 24 cm. What is the radius of the circle ?
01:31View SolutionPQ is a chord of length 8 cm of a circle of radius 5 cm. The tangents at P and Q intersect at a point T . Find the length TP .
02:45View SolutionA vessel is in the form of a hemispherical bowl mounted by a hollow cylinder. The diameter is 14 cm and the height of the vessel is 13 cm. Find the capacity of the vessel.
02:17View SolutionHow many lines of symmetry does the above figure have ?
05:41View SolutionDetermine the point of symmetry of a regular hexagon.
02:21View SolutionDtermine the images of the following figure about the given line :
02:03View SolutionMatch the following Column A to Column B
 02:10View Solution
Match the following Column A to Column B
 02:17View Solution
Match the following Column A to Column B
 02:10View Solution
Find the area of the figure given below.
 04:23View Solution
The area of the shaded part in the figure given below is ______.
 01:59View Solution
The inequation represented by the graph given below is :
01:19View SolutionThe inequation that best describes the graph given below is _________
01:52View SolutionThe inequation that best describes the following graph is _________
03:10View Solution

