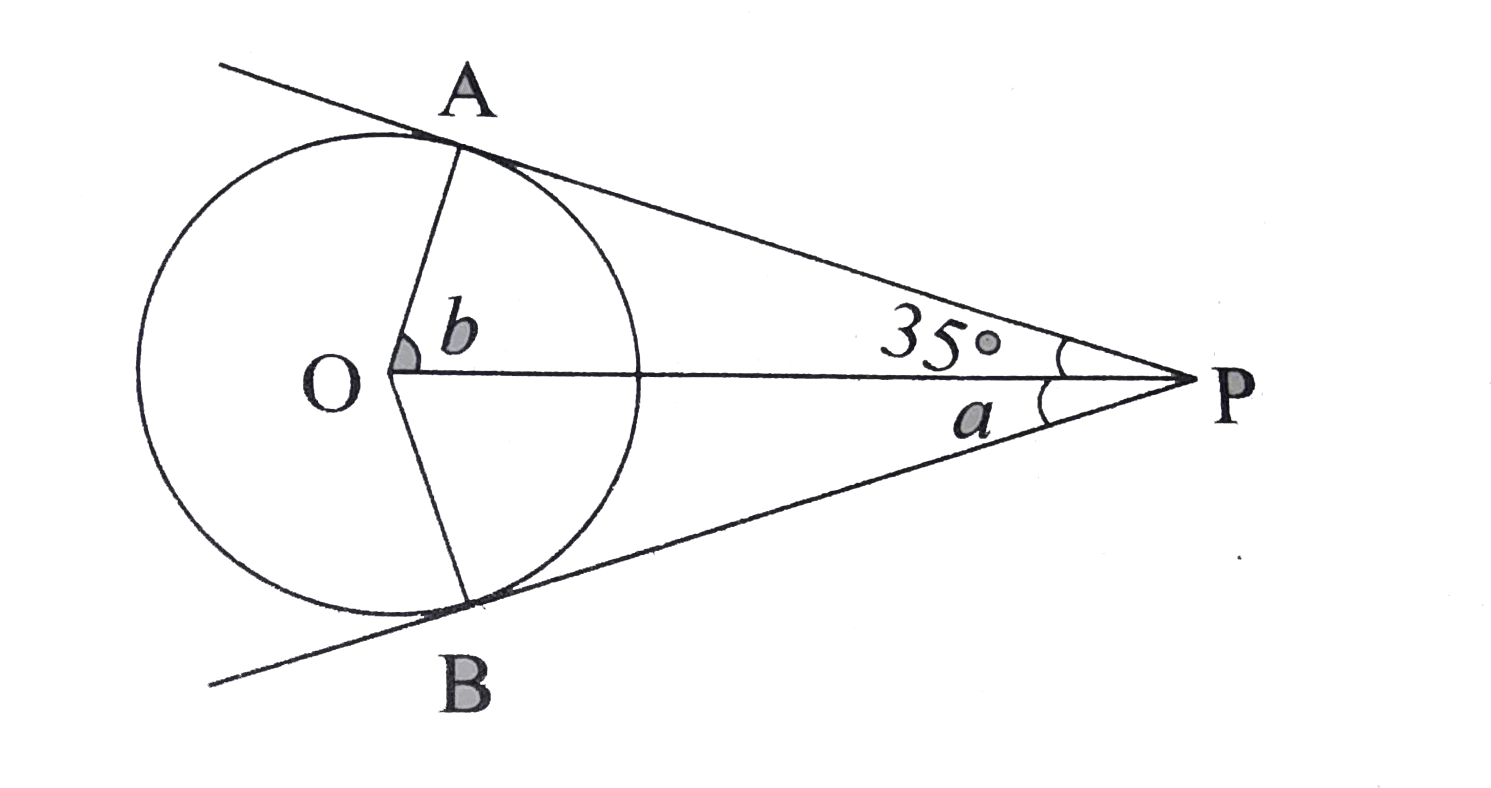
In the given diagram PA and PB are tangents drawn from P to a circle with centre O. ∠OPA=35∘ then a and b is ………
 Solution in Tamil
a=30∘,b=60∘
a=35∘,b=55∘
a=40∘,b=50∘
a=45∘,b=45∘
Step by step video solution for In the given diagram PA and PB are tangents drawn from P to a circle with centre O. angle OPA = 35^@ then a and b is ……… by Maths experts to help you in doubts & scoring excellent marks in Class 10 exams.
Updated on:21/07/2023Topper's Solved these Questions
- SOLVED PAPER 08 (UNSOLVED)BOOK - FULL MARKSCHAPTER - SOLVED PAPER 08 (UNSOLVED)EXERCISE - Part-II
13 Videos
- SOLVED PAPER 08 (UNSOLVED)BOOK - FULL MARKSCHAPTER - SOLVED PAPER 08 (UNSOLVED)EXERCISE - Part-III
12 Videos
- SAMPLE PAPER-1 (Departmental Model Paper) BOOK - FULL MARKSCHAPTER - SAMPLE PAPER-1 (Departmental Model Paper) EXERCISE - PART - I (Choose the correct answer)
5 Videos
- STATISTICS AND PROBABILITYBOOK - FULL MARKSCHAPTER - STATISTICS AND PROBABILITYEXERCISE - Additional question solved
65 Videos
Similar Questions
Show that the function f:N→N defined by f(m)=m2+m+3 is one-one function.
View SolutionIf X ={-5,1,3,4} and Y={a,b,c} , then which of the following relations are function from X to Y ?
(i) R1={(−5,a),(1,a),(3,b)}
(ii) R2={(−5,b),(1,b),(3,a),(4,c)}
(iii) R3={(−5,a),(1,a),(3,b),(4,c),(1,b)}
View SolutionIf n(A×B)=6andA={1,3}, then n(B) is
View SolutionThe range of first 10 prime numbers is ____.
View SolutionIn the given figure (not to scale), O is the centre of the circle. A,B,C and D are concyclic and AB=CD . If /_MON =120^(@) , then find /_ OPN .
View SolutionDetermine the point of symmetry of a regular hexagon.
View SolutionDtermine the images of the following figure about the given line :
View SolutionIn the given figure, AB is a diameter, O is the center of the circle and ∠OCB=50∘ then find ∠DBC.
View SolutionMatch the following Column A to Column B

View SolutionMatch the following Column A to Column B

View SolutionMatch the following Column A to Column B

View SolutionFind the area of the figure given below.

View SolutionThe inequation represented by the graph given below is :
View SolutionThe inequation that best describes the graph given below is _________
View SolutionThe inequation that best describes the following graph is _________
View SolutionWhich inequations represent the shaded region in the given figure
View Solution
