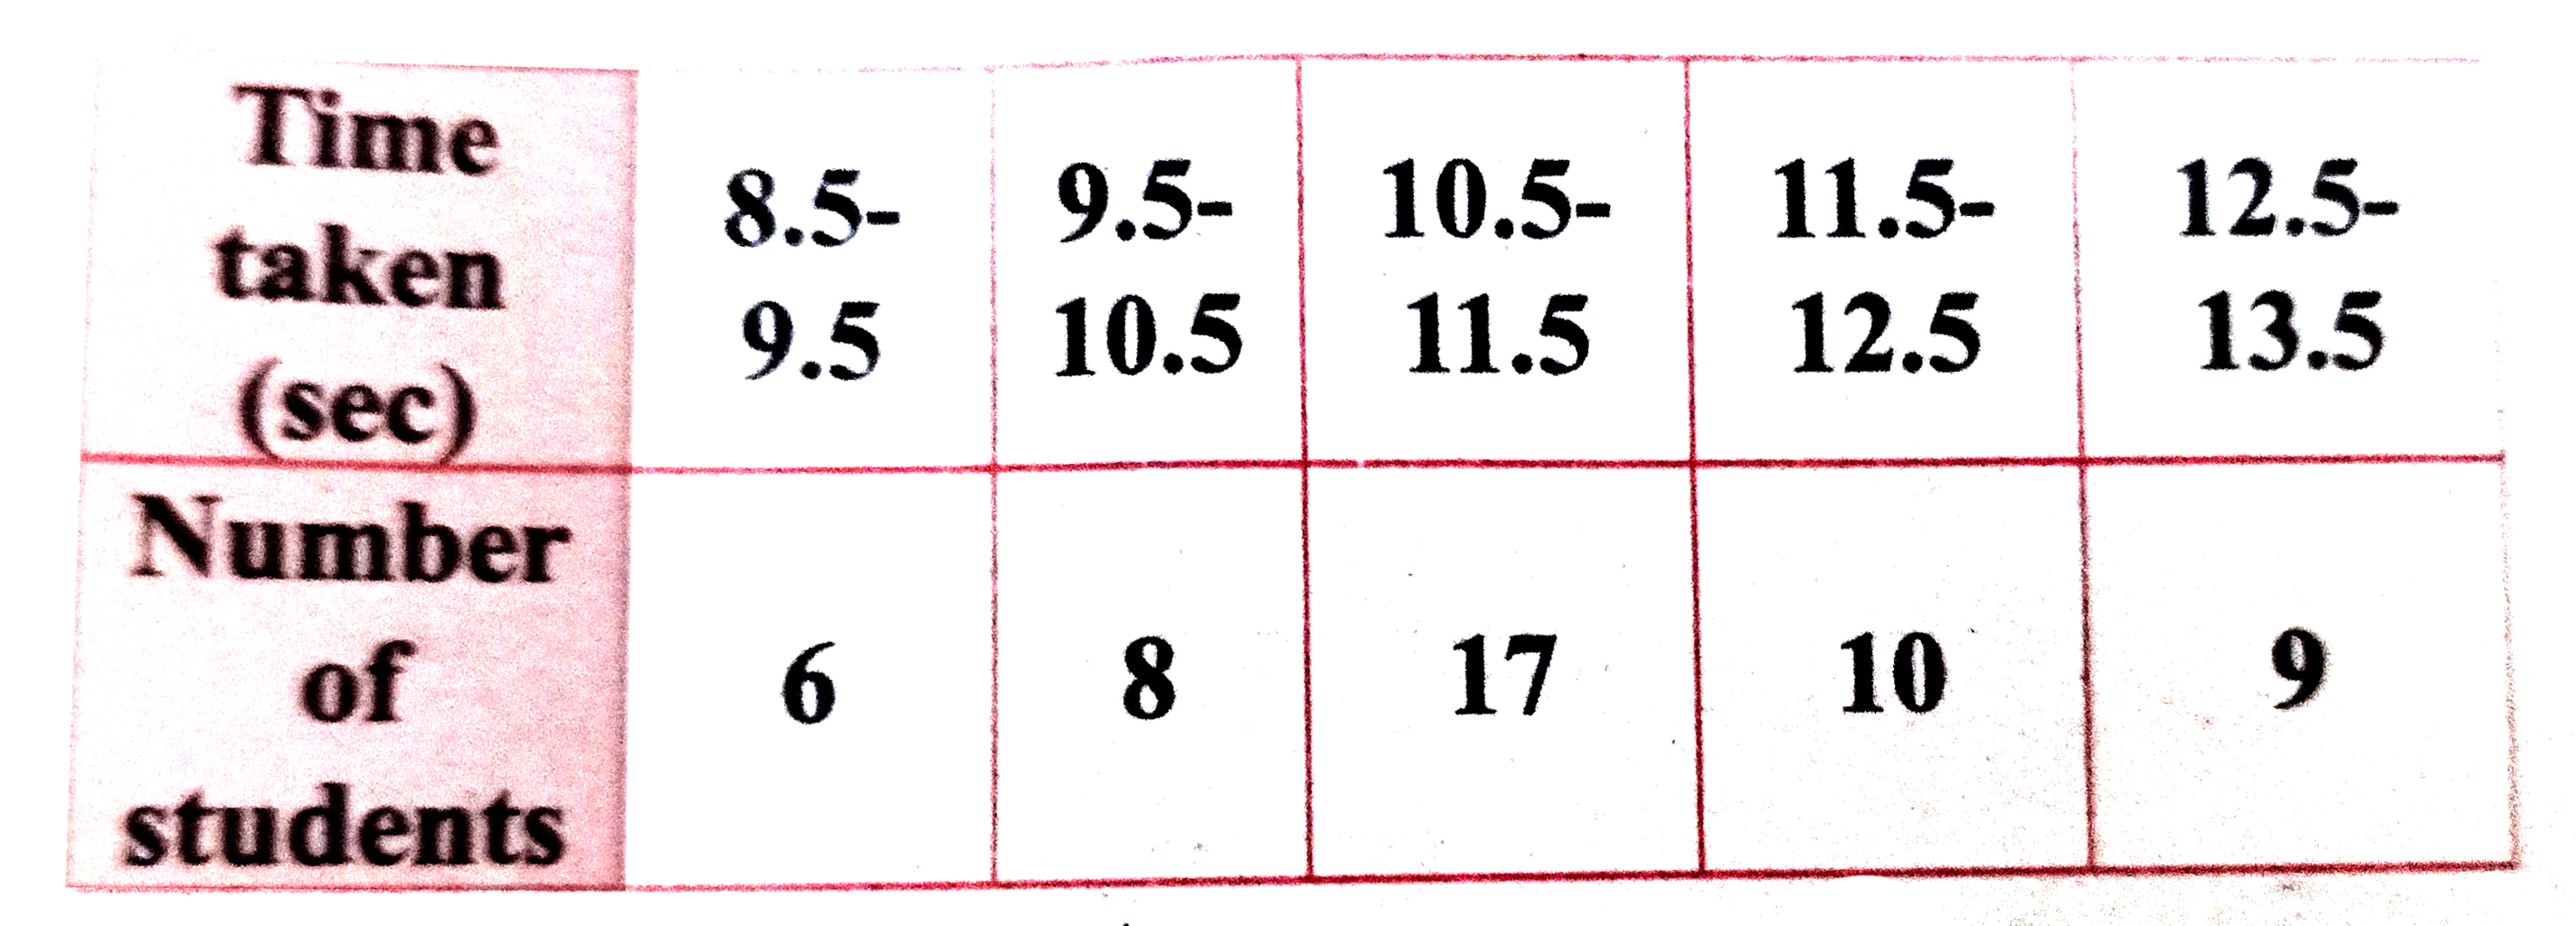
The time taken by 50 students to complete a 100 meter race are given below. Find its standard deviation.
 Solution in Tamil
Step by step video & image solution for The time taken by 50 students to complete a 100 meter race are given below. Find its standard deviation. by Maths experts to help you in doubts & scoring excellent marks in Class 10 exams.
Updated on:21/07/2023Topper's Solved these Questions
- SAMPLE PAPER 16 (UNSOLVED)BOOK - FULL MARKSCHAPTER - SAMPLE PAPER 16 (UNSOLVED)EXERCISE - PART-IV
1 Videos
- SAMPLE PAPER 16 (UNSOLVED)BOOK - FULL MARKSCHAPTER - SAMPLE PAPER 16 (UNSOLVED)EXERCISE - PART-II
13 Videos
- SAMPLE PAPER -5BOOK - FULL MARKSCHAPTER - SAMPLE PAPER -5EXERCISE - PART -IV
4 Videos
- SAMPLE PAPER 17 (UNSOLVED)BOOK - FULL MARKSCHAPTER - SAMPLE PAPER 17 (UNSOLVED)EXERCISE - PART-IV
1 Videos
Similar Questions
Draw the graph of y=x2+x and hence solve x2+1=0.
View SolutionThe distance S an object travles under the influence of gravity in time t seconds is given by S(t)=12gt2+at+b where, (g is the acceleration due to gravity), a, b, are constants. Check if the function S(t) is one-one.
View SolutionDraw a circle of radius 4.5 cm. Take a point on the circle. Draw the tangent at that point using the alternate segment theorem.
View SolutionDraw the graph of y=x2−4x+3 and use it to solve x2−6x+9=0
View SolutionDetermine the point of symmetry of a regular hexagon.
View SolutionDtermine the images of the following figure about the given line :
View SolutionMatch the following Column A to Column B

View SolutionMatch the following Column A to Column B

View SolutionMatch the following Column A to Column B

View SolutionFind the area of figure given below.

View SolutionFind the perimeter of the figure given below.

View SolutionFind the area of the figure given below.

View SolutionThe area of the shaded part in the figure given below is ______.

View SolutionThe inequation represented by the graph given below is :
View SolutionThe inequation that best describes the graph given below is _________
View SolutionThe inequation that best describes the following graph is _________
View Solution
