In the following table, pass percentage of three schools from the year 2001 to the year 2006 are given. Which school students' performance is more consistent?
200120022003200420052006School X808979838465School Y929476758063School Z939767637085
X
Y
Z
X and Y
The correct Answer is:A
(i) Find the average (mean) pass percentage of all the schools.
(ii) The school with the maximum pass percentage is more consisternt.
Topper's Solved these Questions
- STATISTICSBOOK - PEARSON IIT JEE FOUNDATIONCHAPTER - STATISTICSEXERCISE - LEVEL-2
20 Videos
- STATISTICSBOOK - PEARSON IIT JEE FOUNDATIONCHAPTER - STATISTICSEXERCISE - LEVEL-3
19 Videos
- STATISTICSBOOK - PEARSON IIT JEE FOUNDATIONCHAPTER - STATISTICSEXERCISE - ESSAY TYPE QUESTION
5 Videos
- SIMPLE INTEREST AND COMPOUND INTEREST BOOK - PEARSON IIT JEE FOUNDATIONCHAPTER - SIMPLE INTEREST AND COMPOUND INTEREST EXERCISE - CONCEPT APPLICATION
1 Videos
- TRIGONOMETRY BOOK - PEARSON IIT JEE FOUNDATIONCHAPTER - TRIGONOMETRY EXERCISE - Level 3
15 Videos
Similar Questions
Calculate the three -yearly moving averages and display these and the original figures on the same graph.
Year 2001200220032004200520062007Values 20 40 50 70 80 100 130
View SolutionStudy the following graph and table carefully and answer the question given below it. Percentage of Tall Camels, Small Birds and White Dogs in a state in various years.
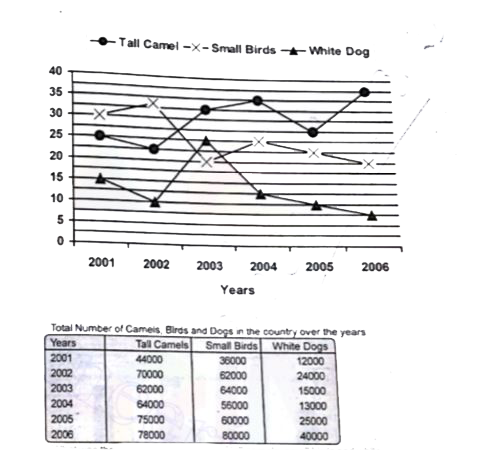
Total Number of Camels, Birds and Dogs in the country over the years
YearsTall CamelsSmall BirdsWhite Dogs200144000360001200020027000062000240002003620006400015000200464000560001300020057500060000250002006780008000040000
What was the approximate average of tall camels, small birds and white dogs in the year 2006 ?
View Solution
Knowledge Check
The following table shows the pass percentage of results of four schools in the past four year .

In which academic year did all the schools have pass percentage as more than 80?
A)2012-13
B)2014-15
C)2015-16
D) 2013-14A2012-13B2014-15C2015-16D2013-14Study the following graph and table carefully and answer the question given below it. Percentage of Tall Camels, Small Birds and White Dogs in a state in various years.
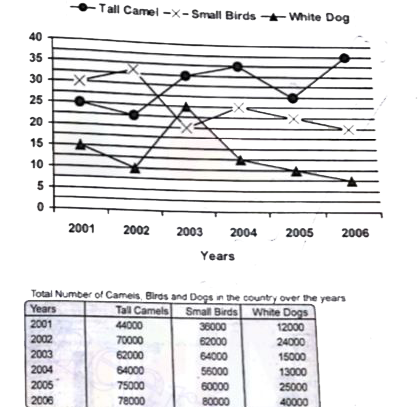
Total Number of Camels, Birds and Dogs in the country over the years
YearsTall CamelsSmall BirdsWhite Dogs200144000360001200020027000062000240002003620006400015000200464000560001300020057500060000250002006780008000040000
What was the total number of white dog in the year 2001, 2003 and 2005 together ?A8000B8500C8050D5080Study the following graph and table carefully and answer the question given below it. Percentage of Tall Camels, Small Birds and White Dogs in a state in various years.
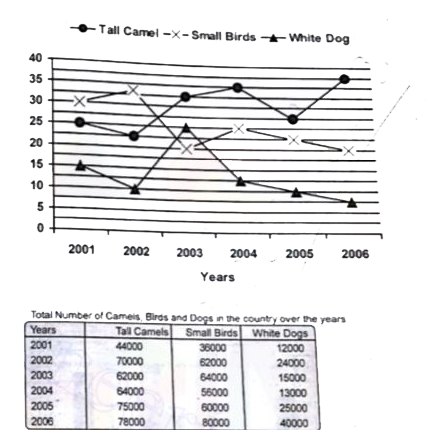
Total Number of Camels, Birds and Dogs in the country over the years
YearsTall CamelsSmall BirdsWhite Dogs200144000360001200020027000062000240002003620006400015000200464000560001300020057500060000250002006780008000040000
What was the respective ratio of the small birds in the year 2005 to the tall camels in the year 2001 ?A4:5B27:22C22:27D6:7
Study the following graph and table carefully and answer the question given below it. Percentage of Tall Camels, Small Birds and White Dogs in a state in various years.
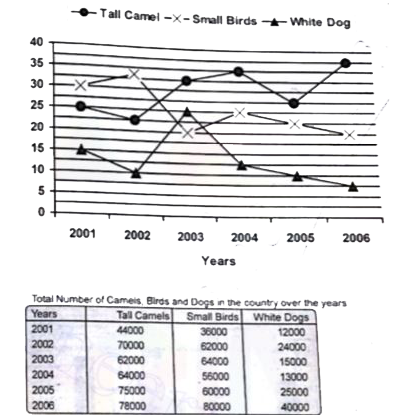
Total Number of Camels, Birds and Dogs in the country over the years
YearsTall CamelsSmall BirdsWhite Dogs200144000360001200020027000062000240002003620006400015000200464000560001300020057500060000250002006780008000040000
The number of tall camels in the year 2004 was what percent of the small birds in the same year ?
View SolutionStudy the following graph and table carefully and answer the question given below it. Percentage of Tall Camels, Small Birds and White Dogs in a state in various years.
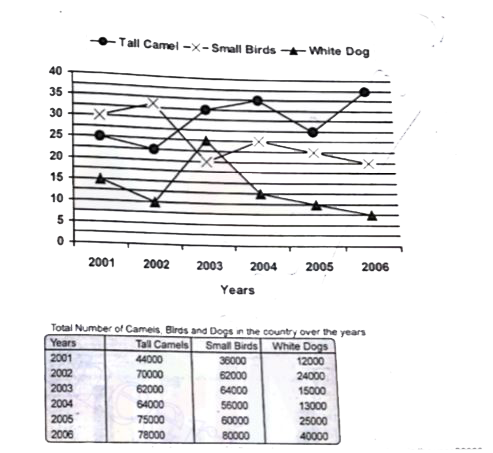
Total Number of Camels, Birds and Dogs in the country over the years
YearsTall CamelsSmall BirdsWhite Dogs200144000360001200020027000062000240002003620006400015000200464000560001300020057500060000250002006780008000040000
What is the difference between the number of small birds and white dogs together in the year 2005 and the number of tall camels in the same year ?
View SolutionStudy the following graph carefully and answer the questions given below. The number of students who joined and left the school in the beginning of year for six years
from 2003 to 2008
Initial Strength of the school is 2000
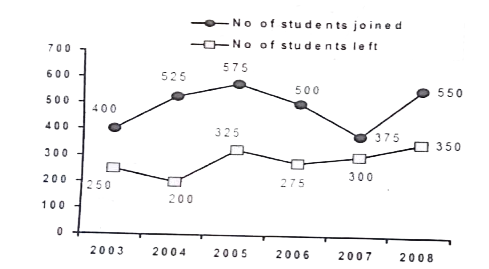
How many students were there in the school during the year 2006?
View SolutionStudy the following graph carefully and answer the questions given below. The number of students who joined and left the school in the beginning of year for six years
from 2003 to 2008
Initial Strength of the school is 2000
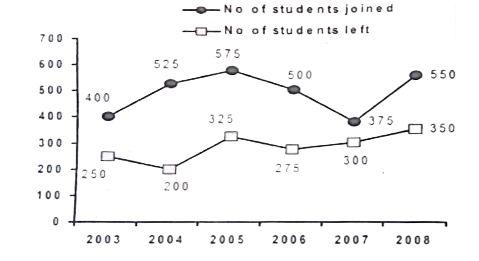
What was the increase in strength of the school from 2004 to 2005?
View SolutionIn each of the following questions, a is followed by information given in three statements. You have to decide the information given in which of the statements is necessary and sufficient to answer the question.
The company earned how much profit in the year 2002 ?
(1) In 2001 the company earned 40% more profit which earned in the year 2003
(2) The company earned the profit of 20 crores together in the year 2001 and 2002
(3) The company earned in 2003, 80% profit which was earned in the year 2002 .
View Solution
