Topper's Solved these Questions
Similar Questions
The length of each equal sides of an isosceles triangle is 13 cm and the perimeter of the triangle is 36cm. Find the length of the unequal side of the triangle.
View Solution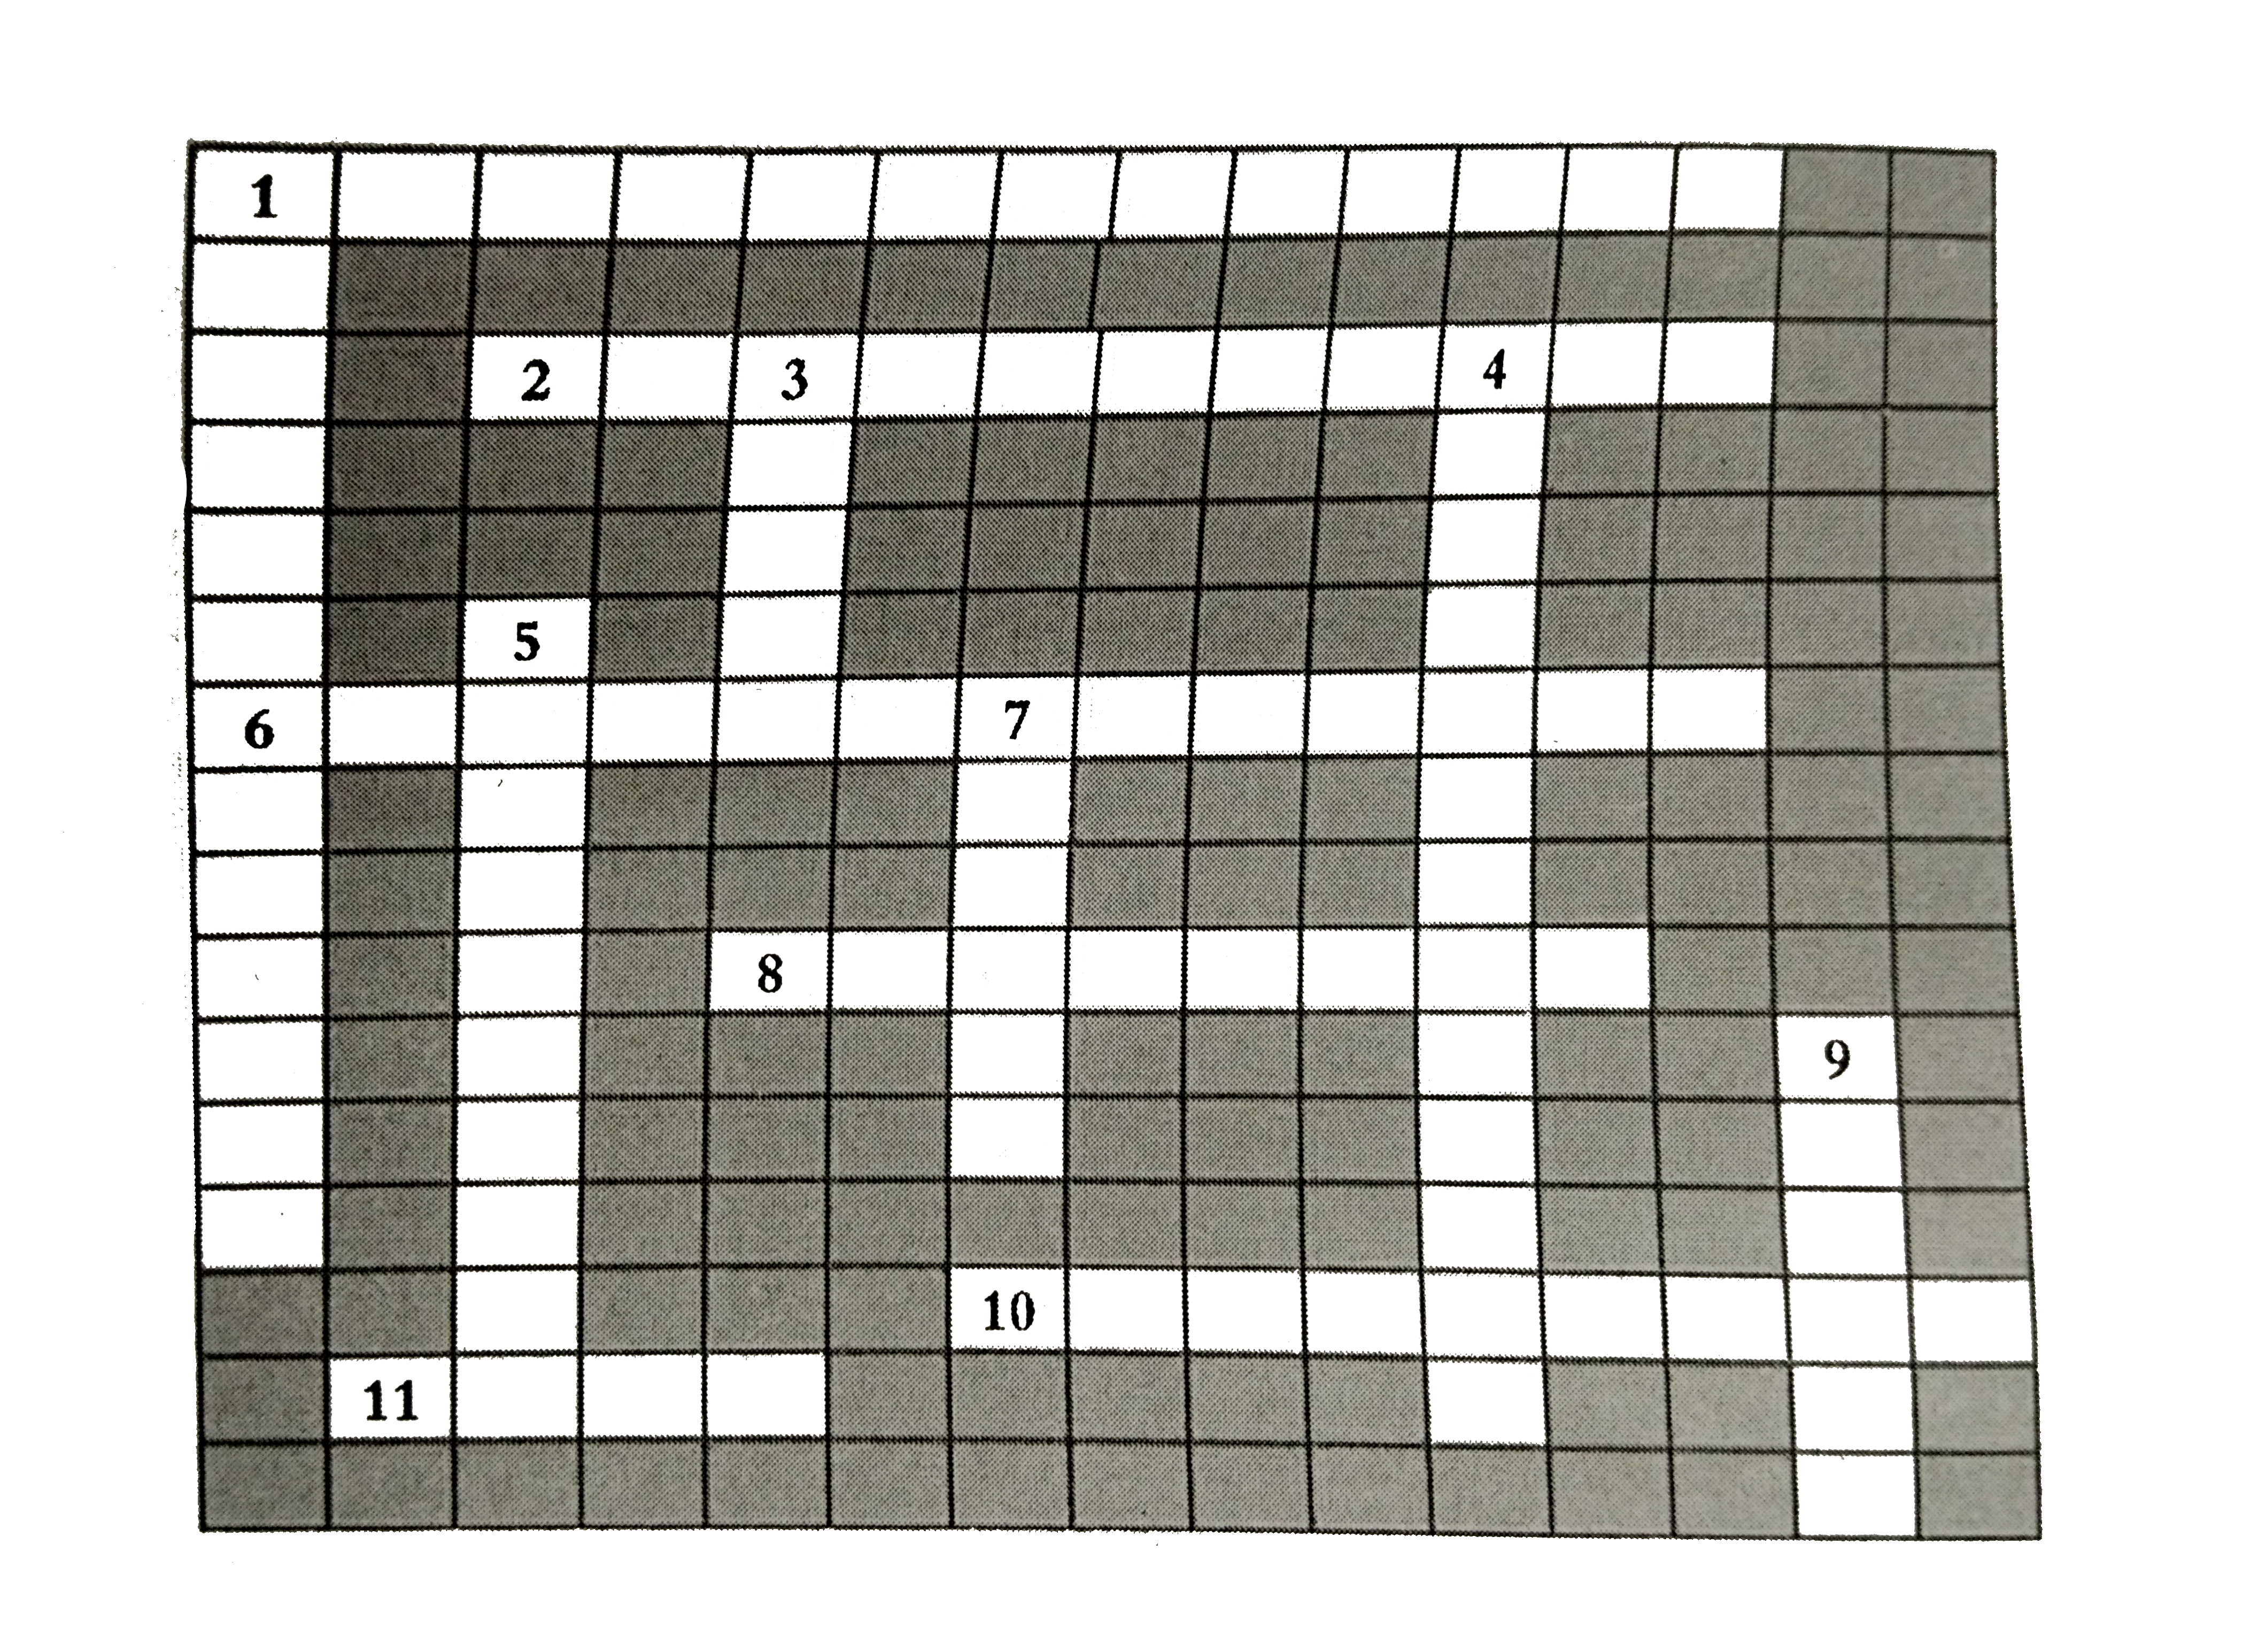
AcrossDown1. Angle P is 30 degrees and angle Q is 60 degrees1. The two non-adjacent angles which are not alternate is2. The line intersecting two or more lines at different points is3. Union of two rays6. Straight lines intersecting at right angles4. Sum of these angles is 180 degrees8. Non-intersecting lines5. Geometrical instrument10.The two interior non-adjacent angles which lie on either side of the transversal is 7. Unit for measuring angles11.The rays which form the angle are9. The common point of the arms of an angle
View Solution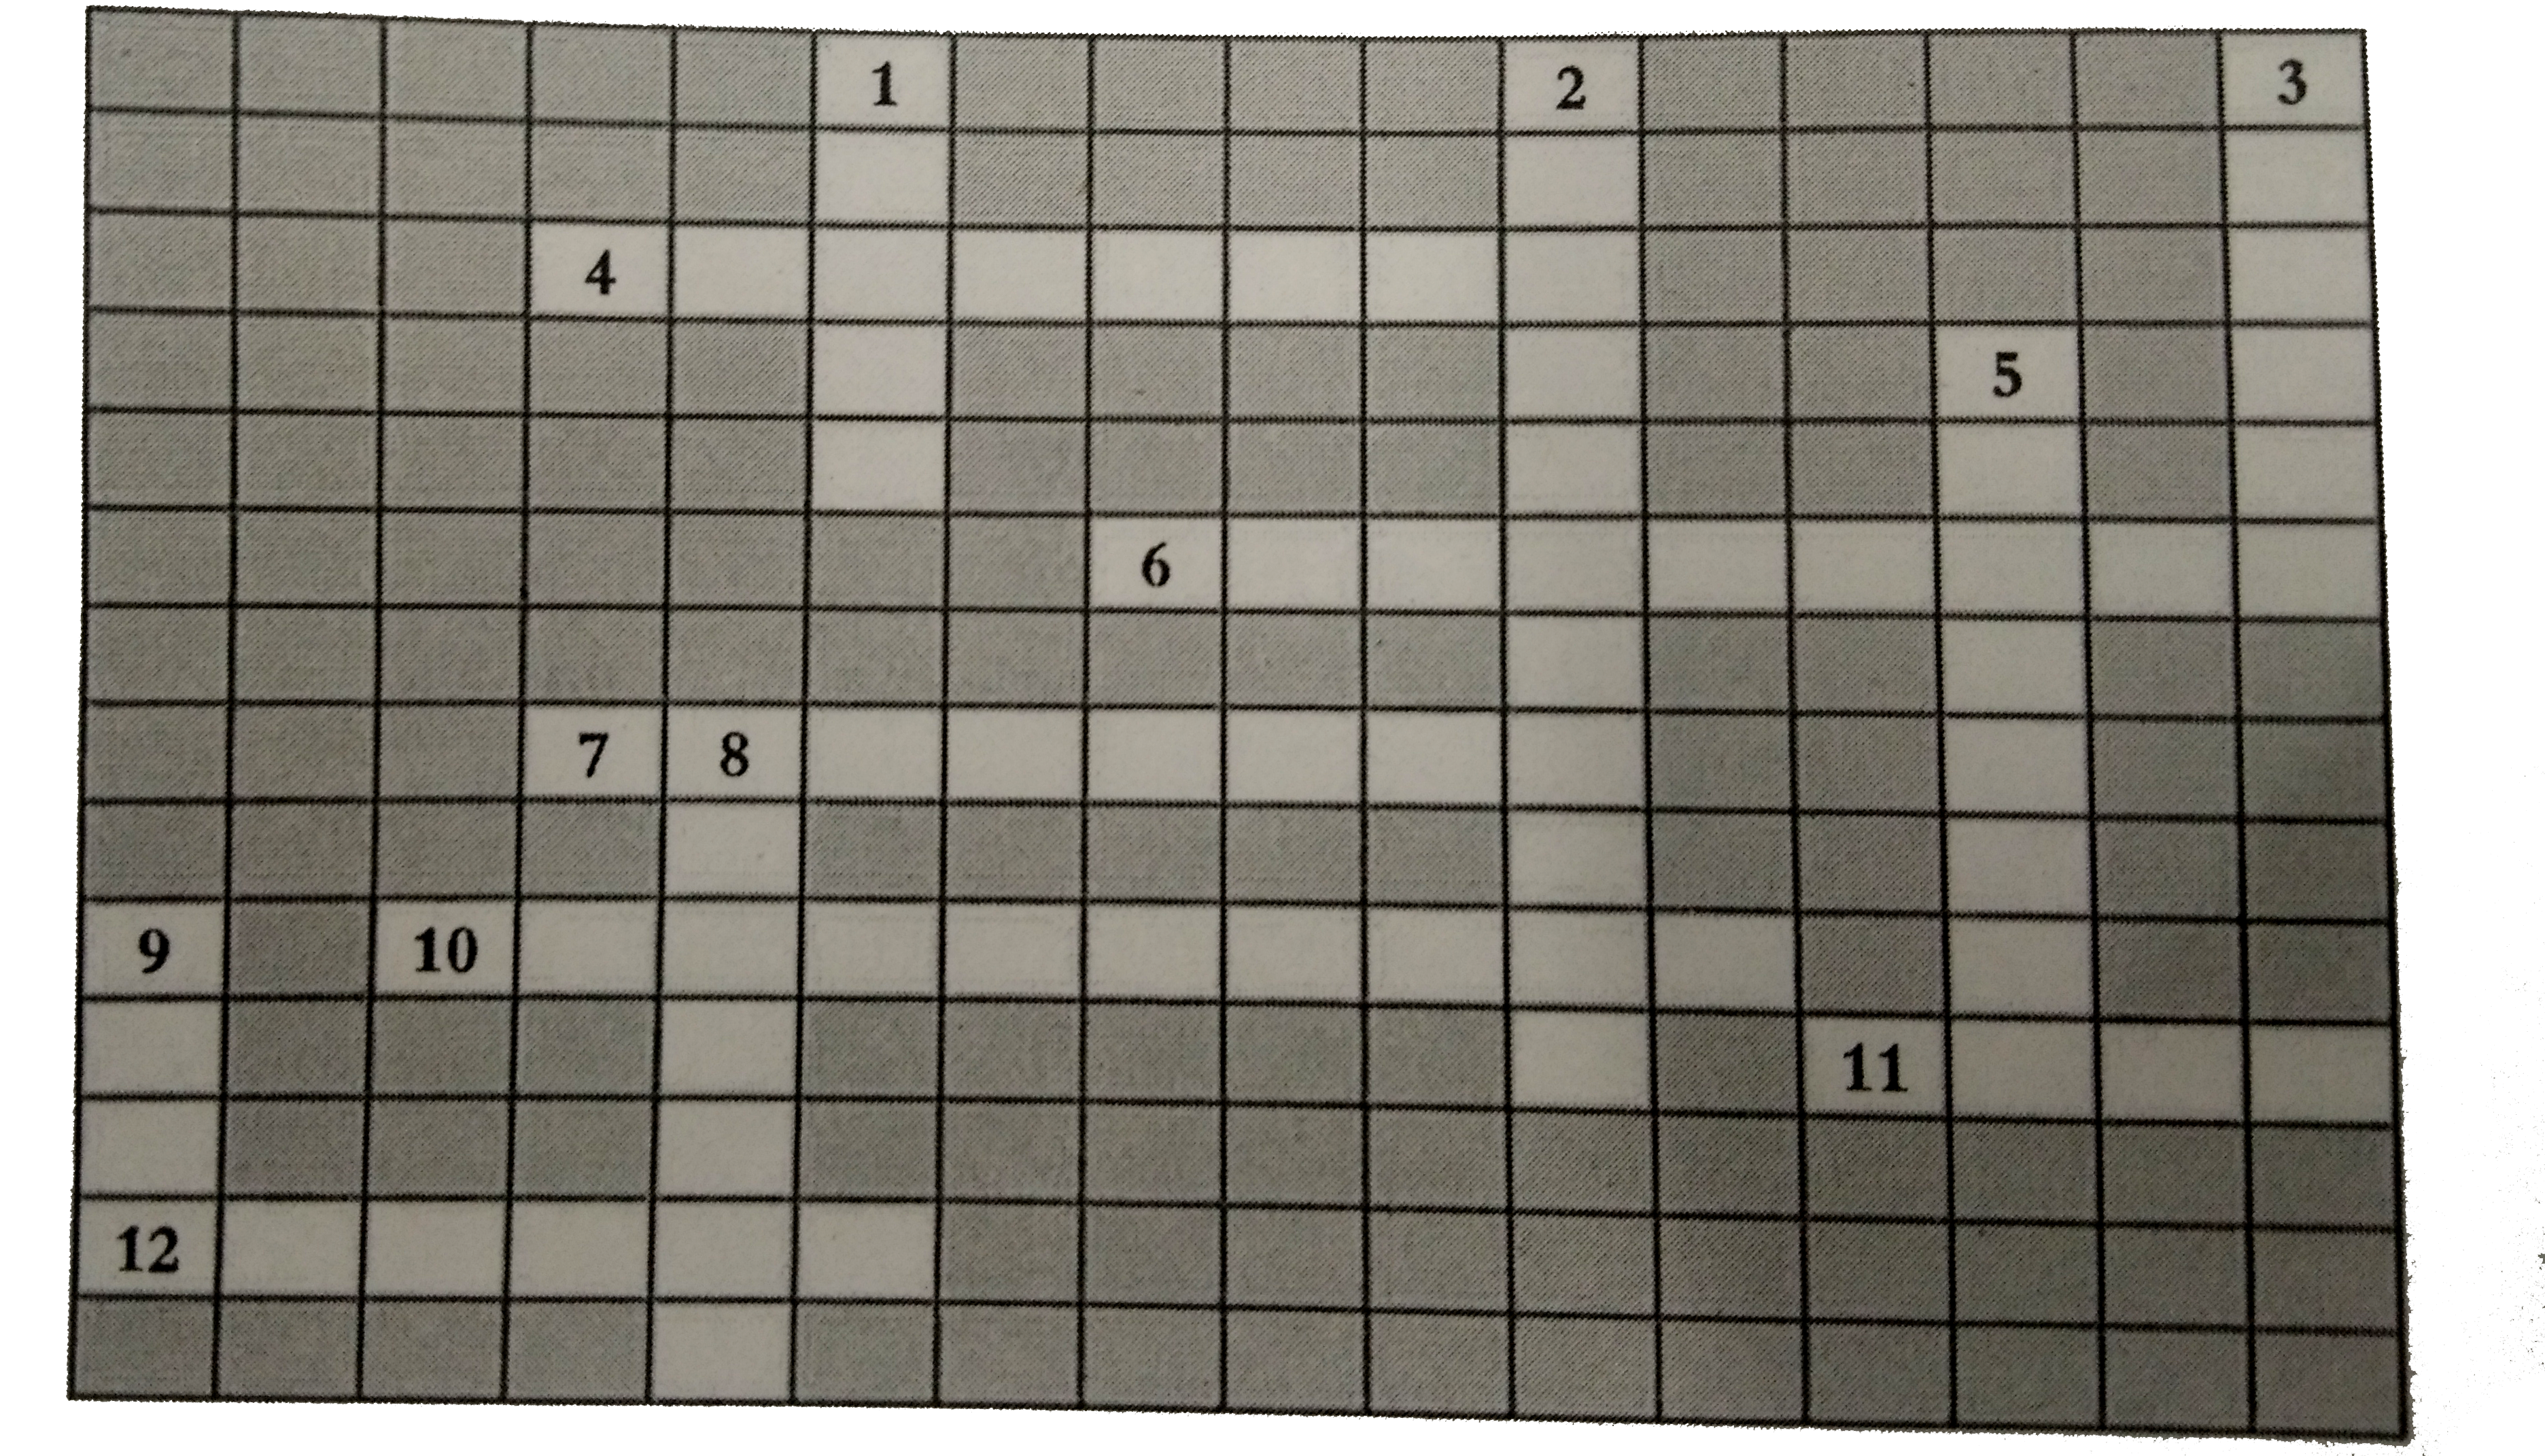
AcrossDown4. The sign of integers less than zero1. Each of the symbols in a number system6. A number that comes just after another2. A number that comes just before another7. The whole numbers and negative natural numbers together3. It is another name of zero10. Expressing a number in words5. Integers greater than zero11. An integer which is neither positive nor negative8. Representation of a number by digits12. The order of operations9. Hundred crores
View SolutionHow many lines of symmetry does the above figure have ?
View SolutionWhich of the following are correct chain isomers of butane ? (i)
View SolutionDetermine the point of symmetry of a regular hexagon.
View SolutionDtermine the images of the following figure about the given line :
View SolutionMatch the following Column A to Column B

View SolutionMatch the following Column A to Column B

View SolutionMatch the following Column A to Column B

View SolutionFind the area of the figure given below.

View SolutionThe area of the shaded part in the figure given below is ______.

View SolutionThe inequation represented by the graph given below is :
View SolutionThe inequation that best describes the graph given below is _________
View SolutionThe inequation that best describes the following graph is _________
View SolutionWhich inequations represent the shaded region in the given figure
View Solution
