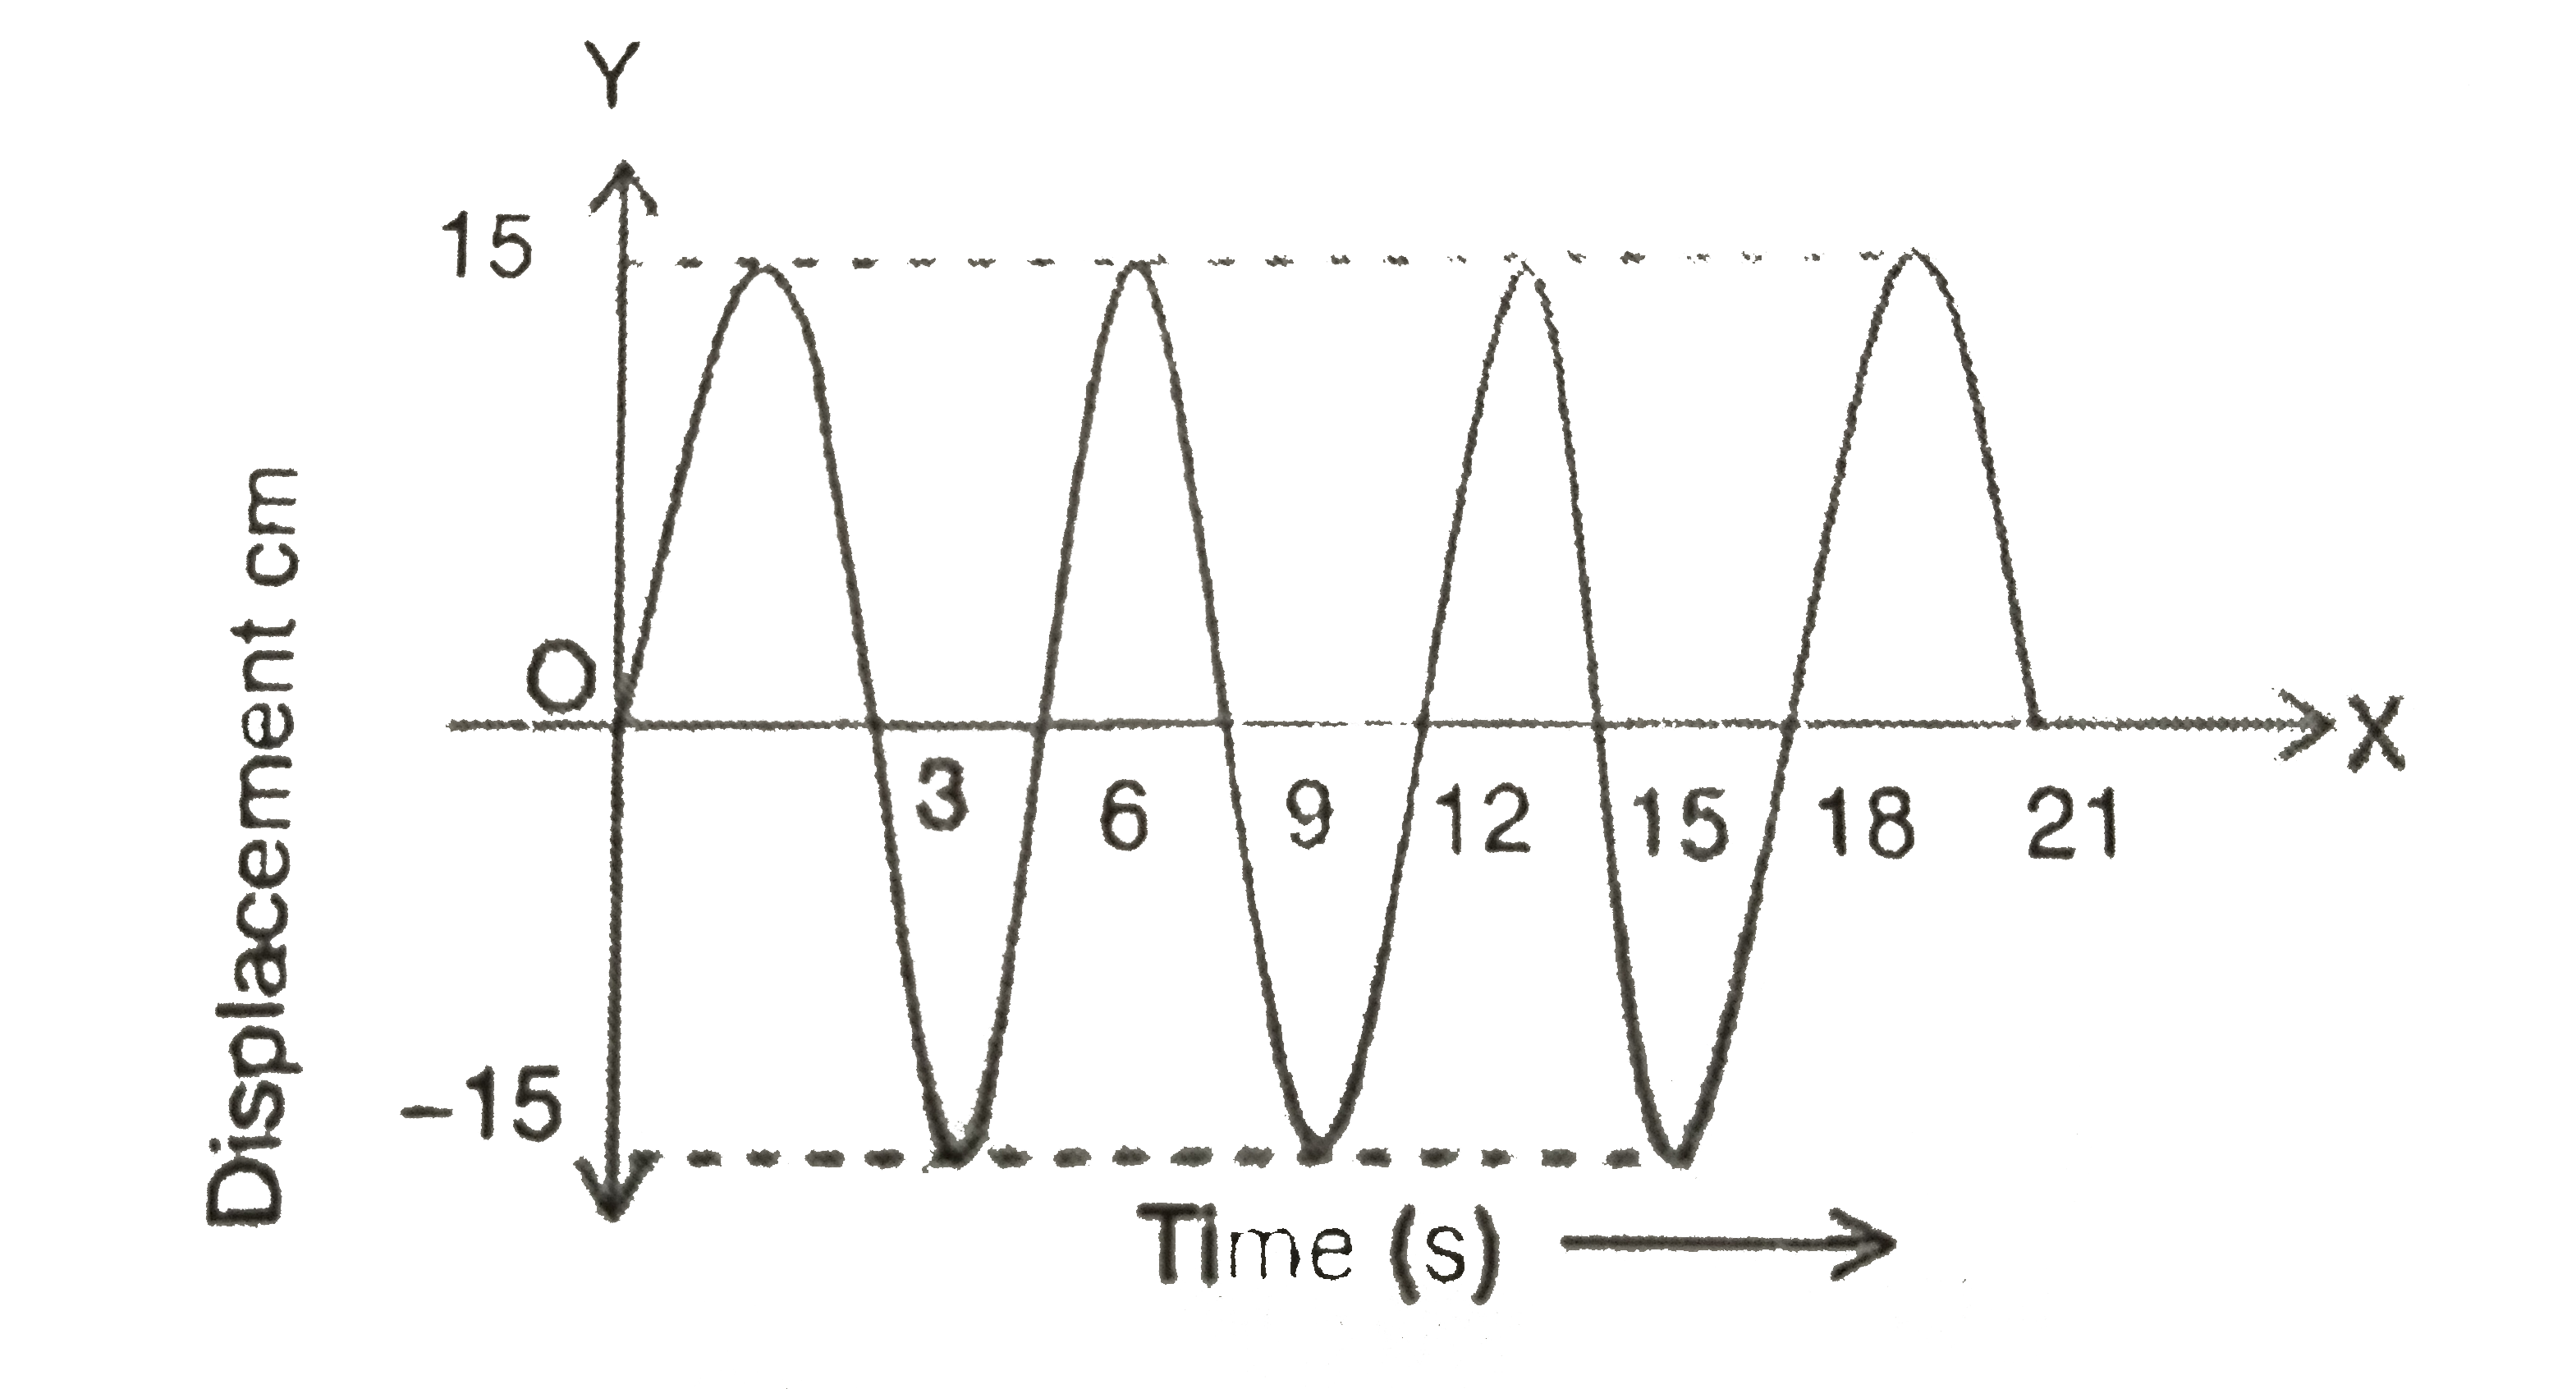
A graph is drawn between the displacement and time taken for the oscillations of a simple pendulum.
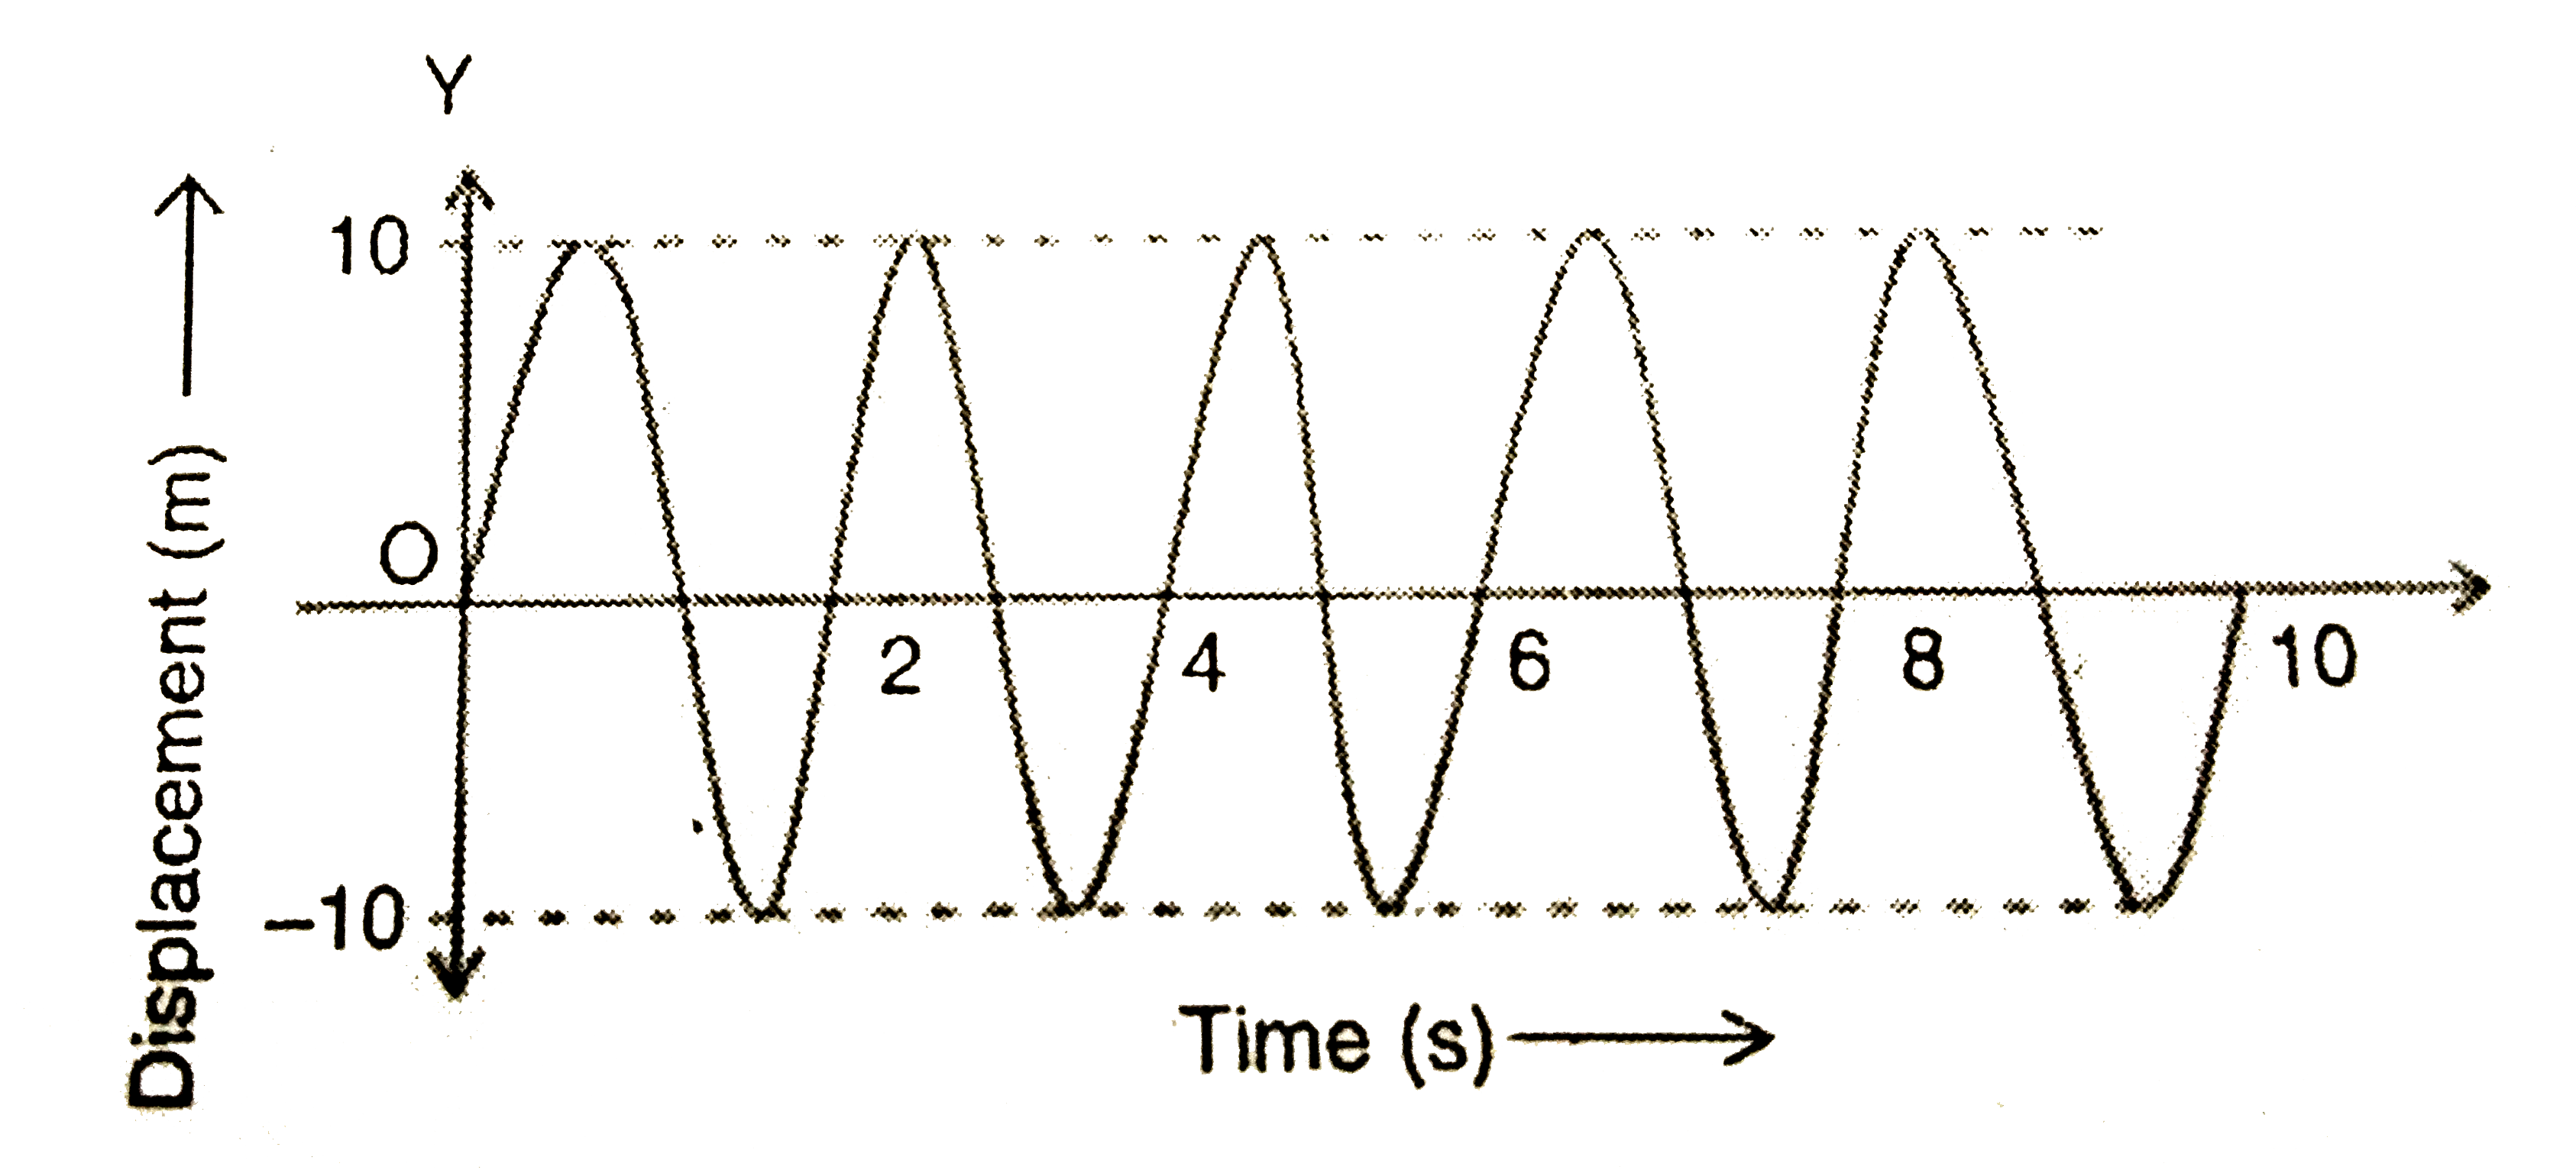
The correct Answer is:D
As the bob is performing '1' oscillation in 2 s, the number of ocillations completed in 10s=102 = 5 ocillations.
Topper's Solved these Questions
- BOOK - PEARSON IIT JEE FOUNDATIONCHAPTER - KINEMATICSEXERCISE - match3videos
KINEMATICS
- BOOK - PEARSON IIT JEE FOUNDATIONCHAPTER - KINEMATICSEXERCISE - Level 118videos
KINEMATICS
- BOOK - PEARSON IIT JEE FOUNDATIONCHAPTER - KINEMATICSEXERCISE - ASSESSMENT TEST (TEST 2 (SELECT THE CORRECT ALTERNATIVE)15videos
KINEMATICS
- BOOK - PEARSON IIT JEE FOUNDATIONCHAPTER - HEAT EXERCISE - Test 214videos
HEAT
- BOOK - PEARSON IIT JEE FOUNDATIONCHAPTER - LIGHTEXERCISE - ASSESSMENT TEST (TEST 2 (SELECT THE CORRECT ALTERNATIVE))15videos
LIGHT
Similar Questions
In the case of a simple pendulum, a graph is drawn between the displacement and time taken for its oscillations as shown in the figure. Then
Time period of the pendulum bob is ______ s.View SolutionIn the case of a simple pendulum, a graph is drawn between the displacement and time taken for its oscillations as shown in the figure . Then
The number of oscillations completed by the bob in one second is _____ .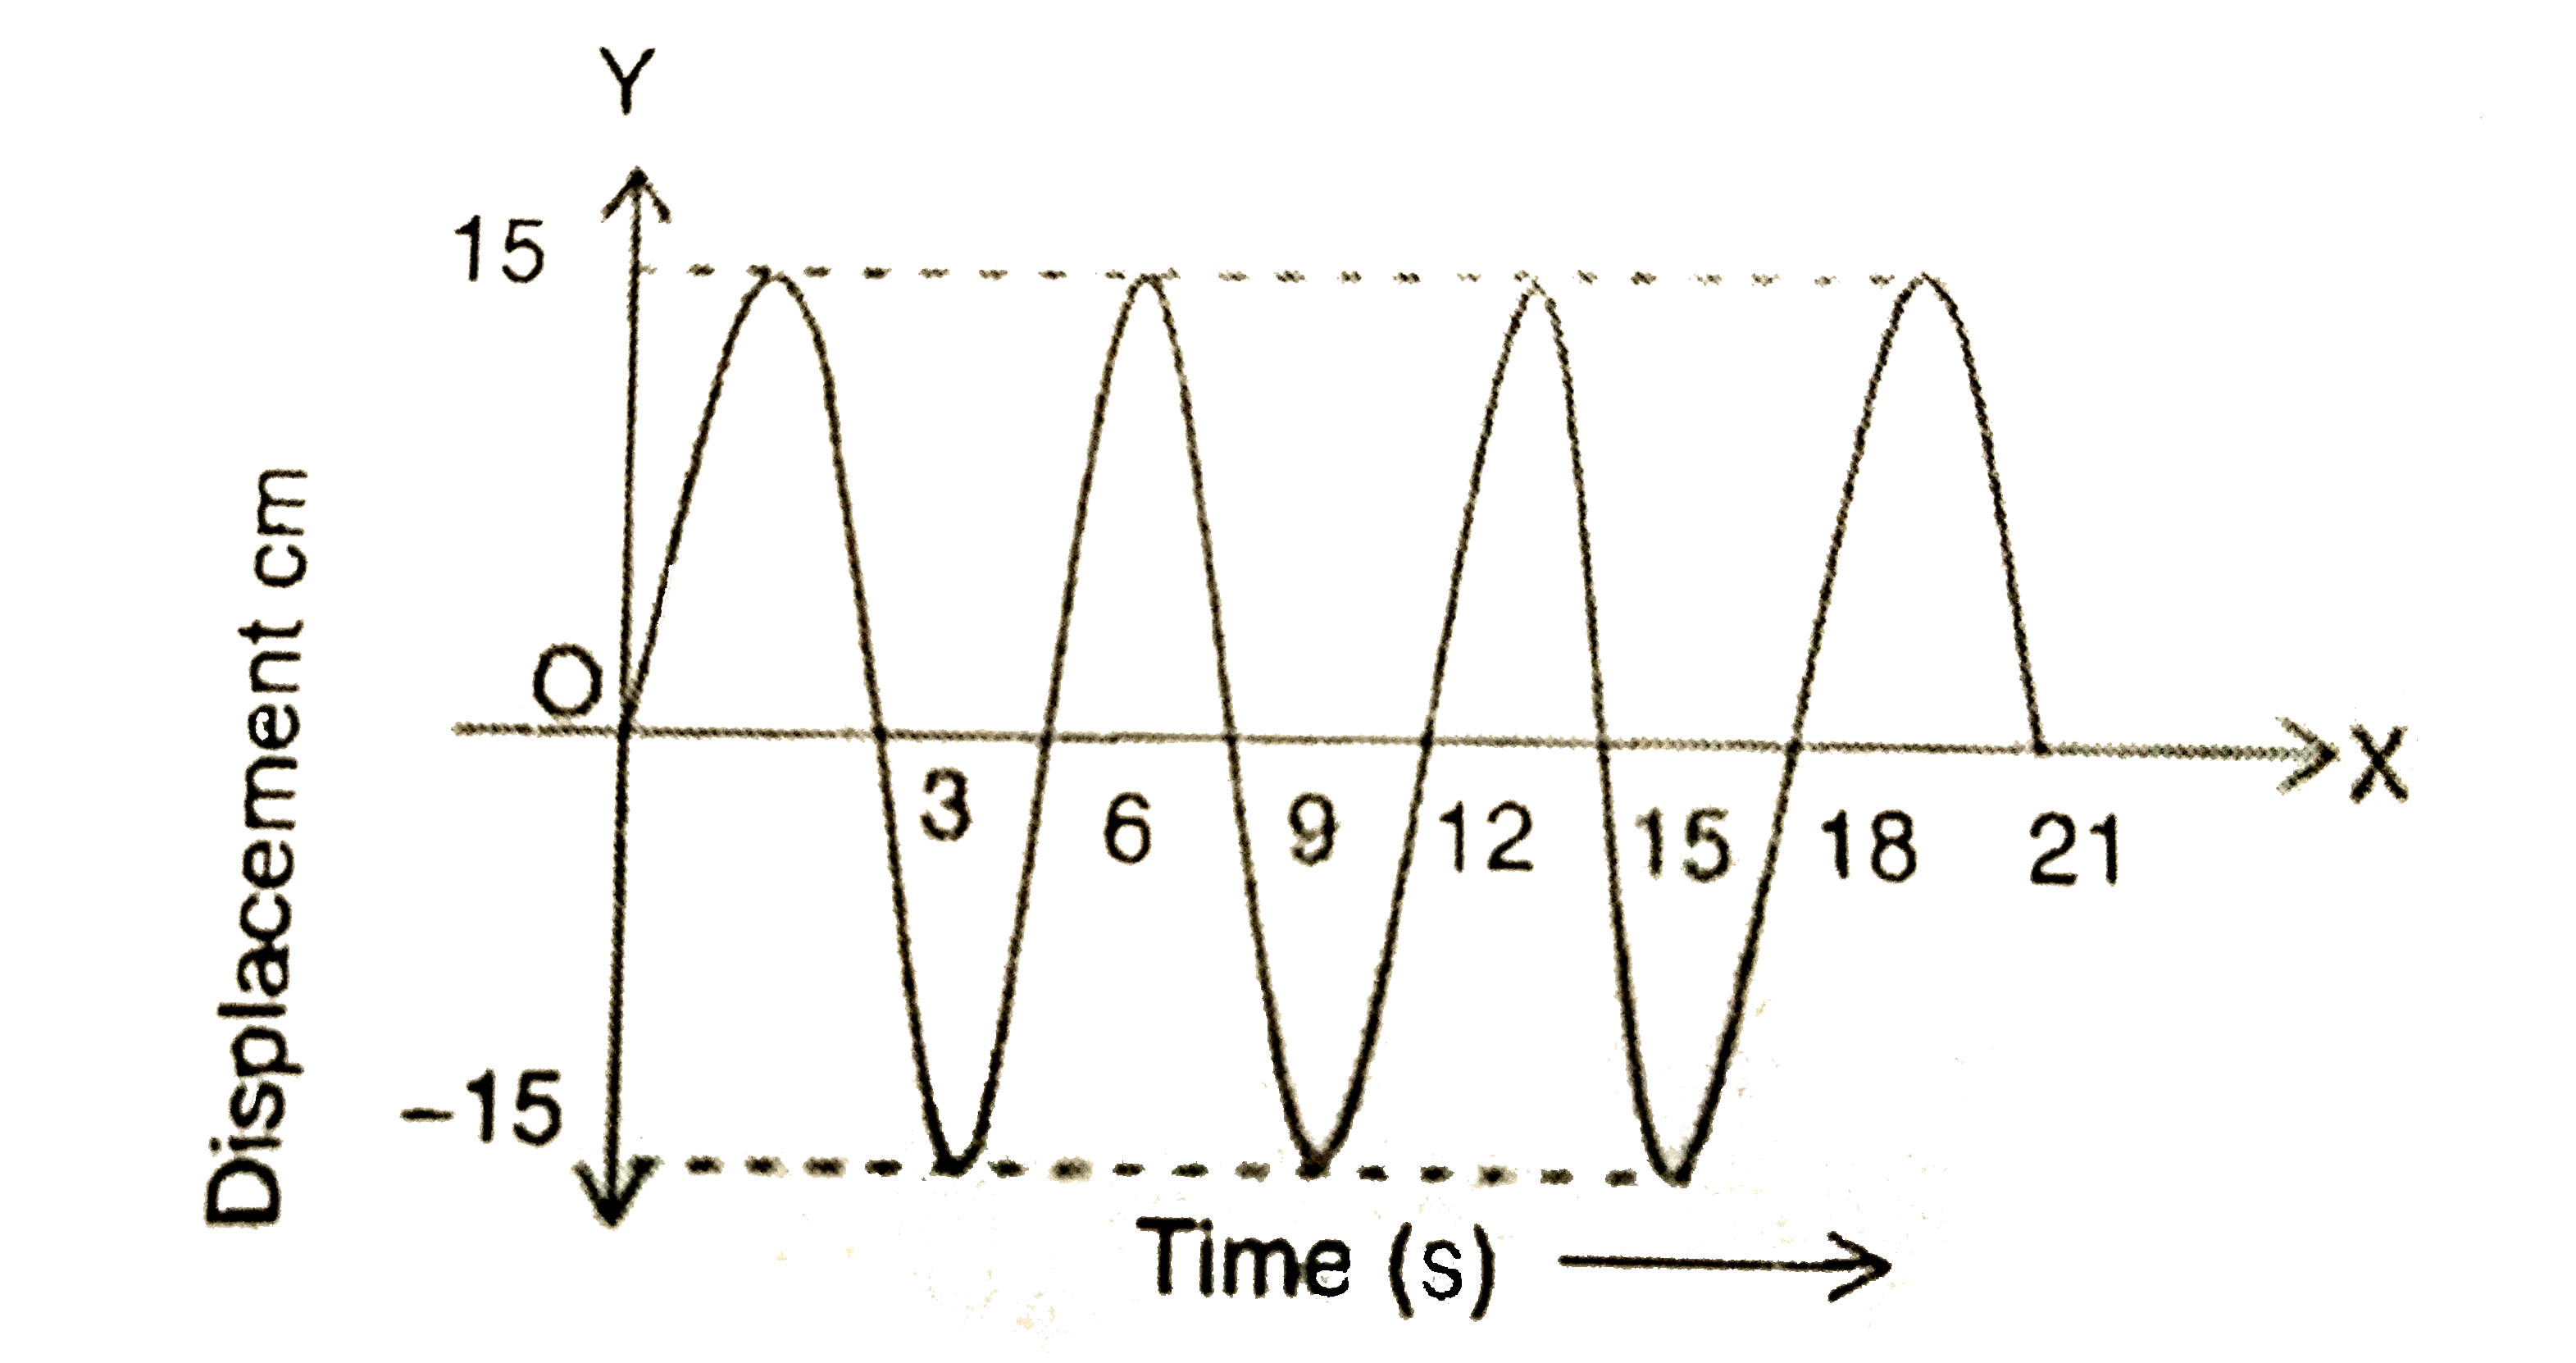 View Solution
Knowledge Check
- Question 1 - Select One
In the case of a simple pendulum, a graph is drawn between the displacement and time taken for its oscillations as shown in the figure. Then
The amplitude of oscillation of the pendulum bob is _____ cm.A15B5C2.5D7.5 - Question 2 - Select One
In the case of a simple pendulum, a graph is drawn between the displacement and time taken for its oscillations as shown in the figure. Then

Time period of the pendulum bob is ______ s.A15B5C2.5D7.5 - Question 3 - Select One
In the case of a simple pendulum, a graph is drawn between the displacement and time taken for its oscillations as shown in the figure . Then
The amplitude of oscillation of the pendulum of the bob is ____ cm .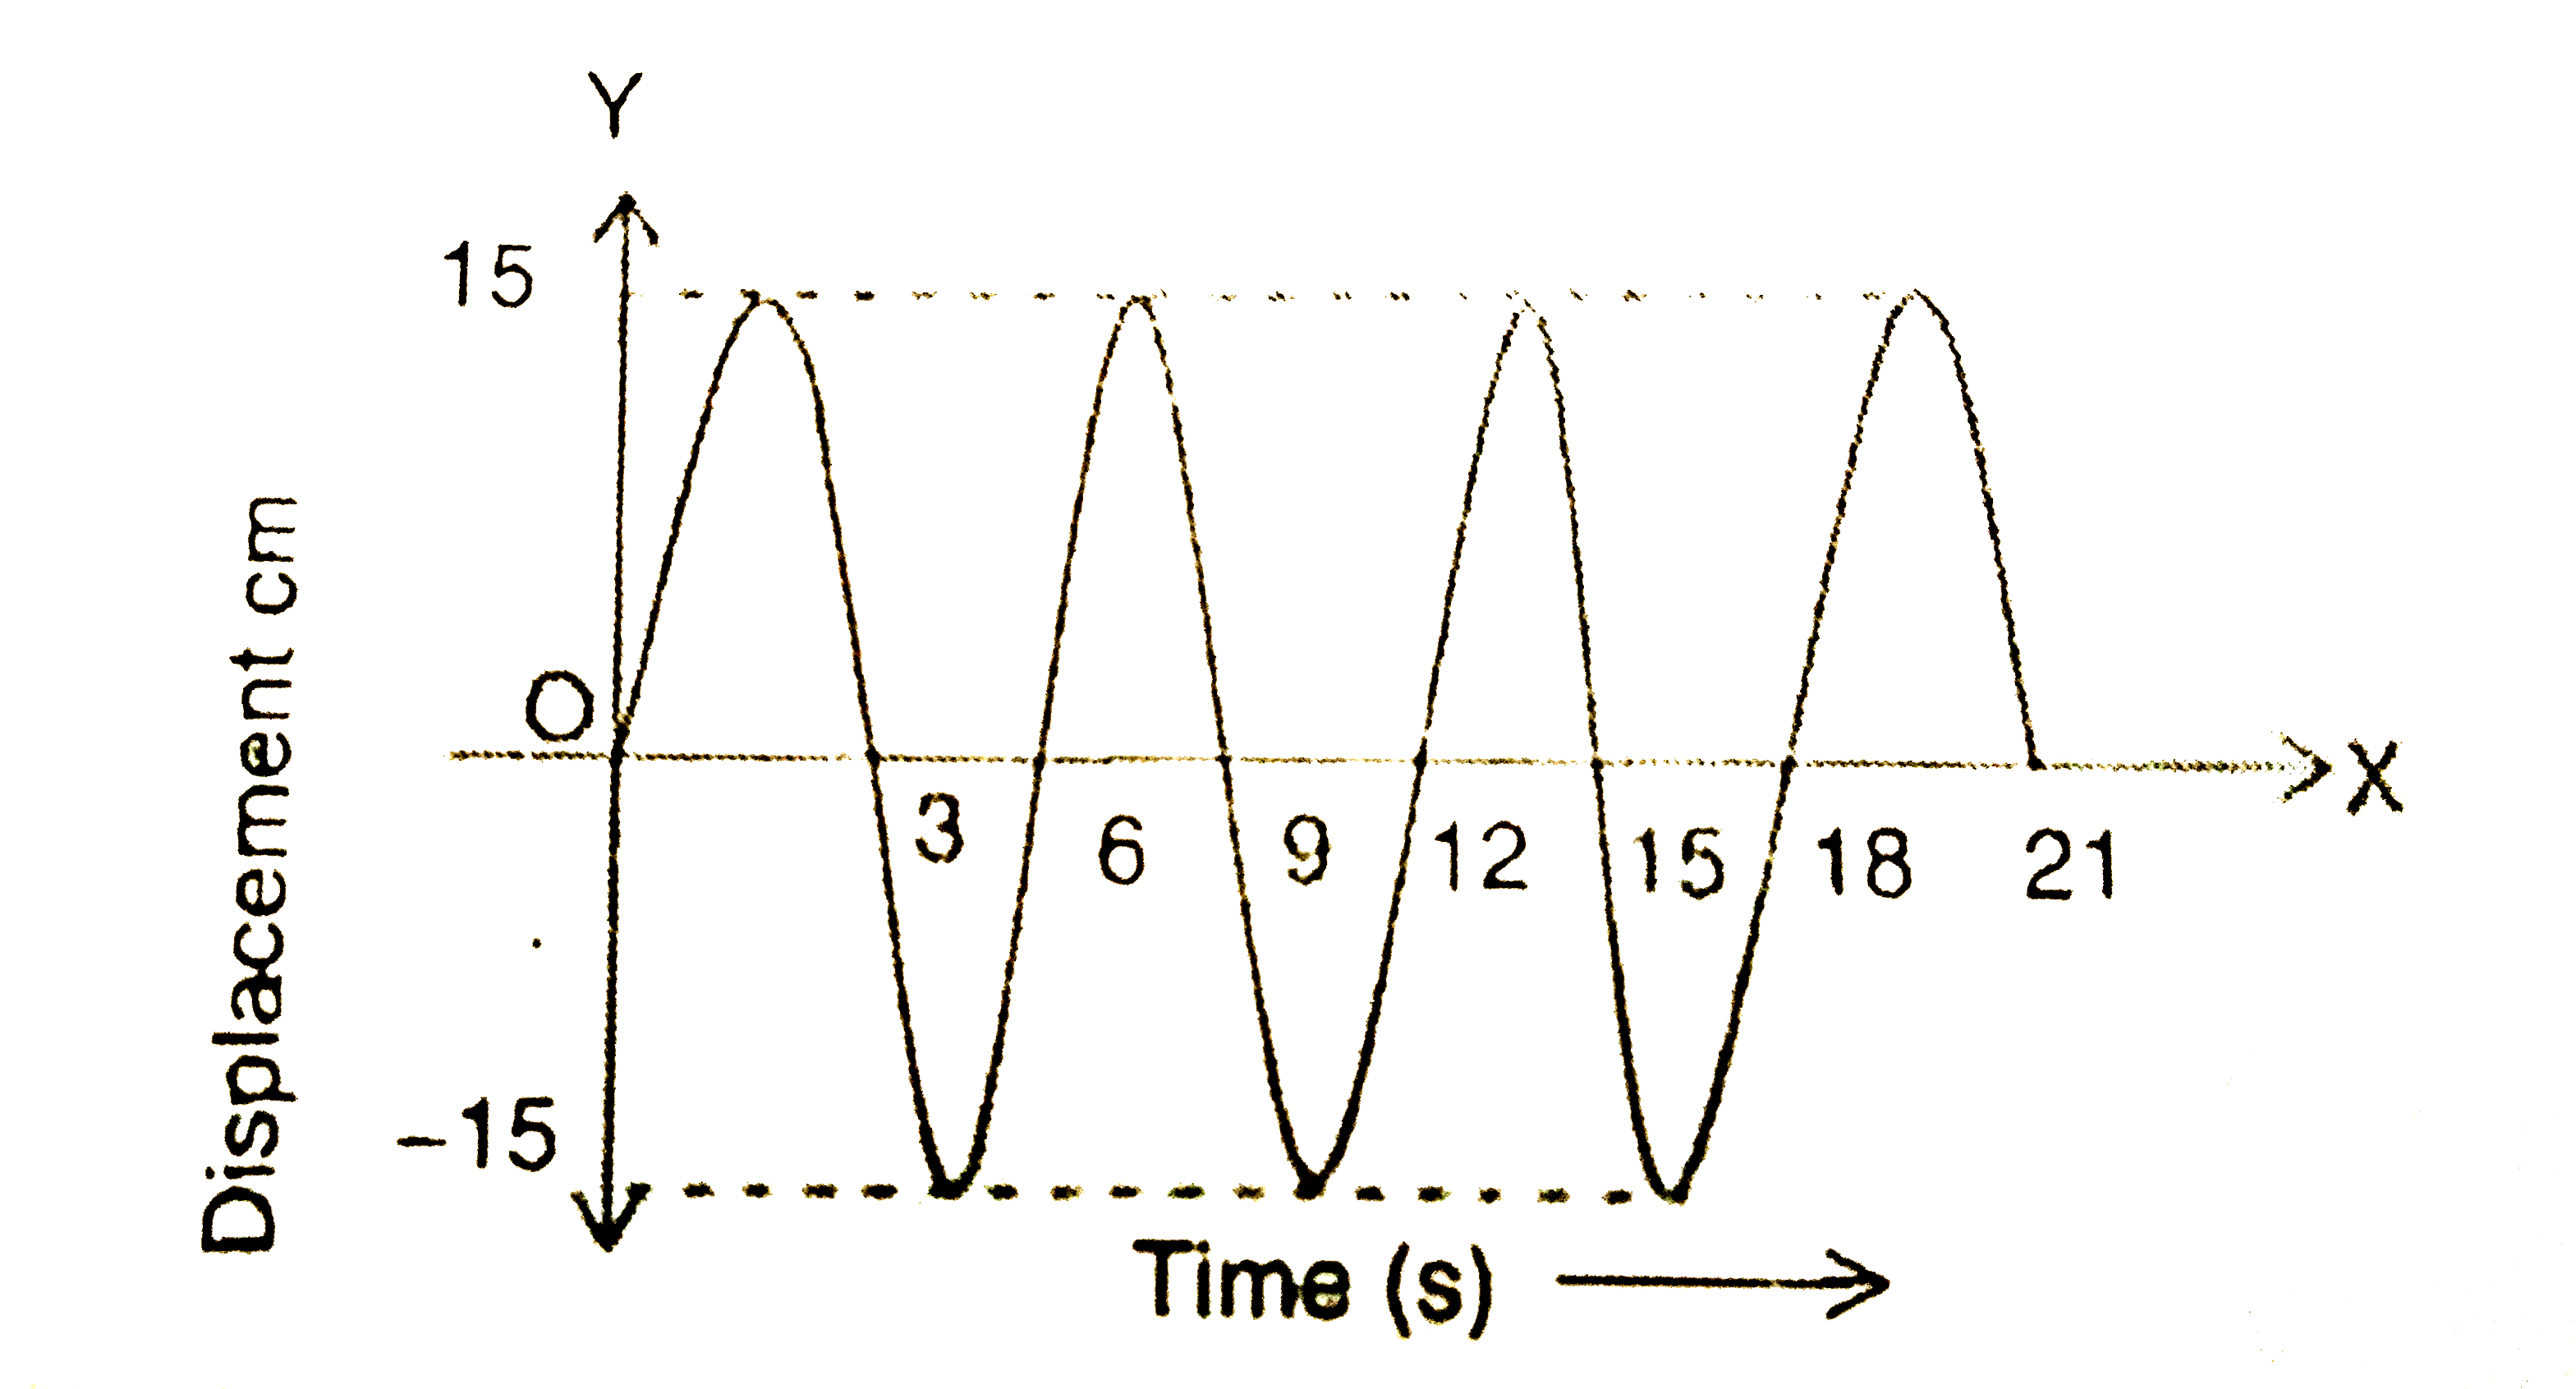 A15B5C2.5D7.5
In the case of a simple pendulum, a graph is drawn between the displacement and time taken for its oscillations as shown in the figure. Then
The number of oscillations completed by the bob in one second is ______.View SolutionIn the case of a simple pendulum, a graph is drawn between the displacement and time taken for its oscillations as shown in the figure. Then

Time period of the pendulum bob is ______ s.View SolutionIn the case of a simple pendulum, a graph is drawn between the displacement and time taken for its oscillations as shown in the figure . Then
From the given figure, the number of oscillation performed by the bob at the end of 21 s is ________
 View Solution
In the case of a simple pendulum, a graph is drawn between the displacement and time taken for its oscillations as shown in the figure. Then

Time period of the pendulum bob is ______ s.View SolutionIn the case of a simple pendulum, a graph is drawn between the displacement and time taken for its oscillations as shown in the figure. Then
From the given figure the number of oscillations per-formed by the bob at the end of 21 s is ______.View Solution

