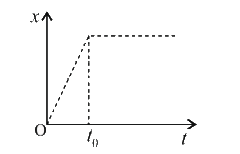
In a displacement versus time graph __________ is taken on the x-axis
Step by step video & image solution for In a displacement versus time graph __________ is taken on the x-axis by Physics experts to help you in doubts & scoring excellent marks in Class 8 exams.
Updated on:21/07/2023Topper's Solved these Questions
- KINEMATICSBOOK - PEARSON IIT JEE FOUNDATIONCHAPTER - KINEMATICSEXERCISE - VERY SHORT ANSWER TYPE QUESTIONS
15 Videos
- KINEMATICSBOOK - PEARSON IIT JEE FOUNDATIONCHAPTER - KINEMATICSEXERCISE - ESSAY TYPE QUESTIONS
3 Videos
- KINEMATICSBOOK - PEARSON IIT JEE FOUNDATIONCHAPTER - KINEMATICSEXERCISE - LEVEL 3
18 Videos
- CHEMICAL EFFECTS OF ELECTRIC CURRENTBOOK - PEARSON IIT JEE FOUNDATIONCHAPTER - CHEMICAL EFFECTS OF ELECTRIC CURRENTEXERCISE - COMPETITION CORNER (MCQ)
48 Videos
Similar Questions
Knowledge Check
Figure show the displacement - time graph of a particle moving on the x-axis
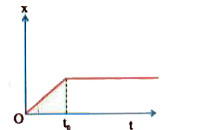 Athe particle is continuously going in positive X directionBthe particle is at restCthe velocity increases up to a time t0 and then becomes constant.Dthe particle moves at constant velocity up to a time t0 and then stops.
A particle is moving in x−y plane with y=x2 and Vx=4−2t. The displacement versus time graph of the particle would be
A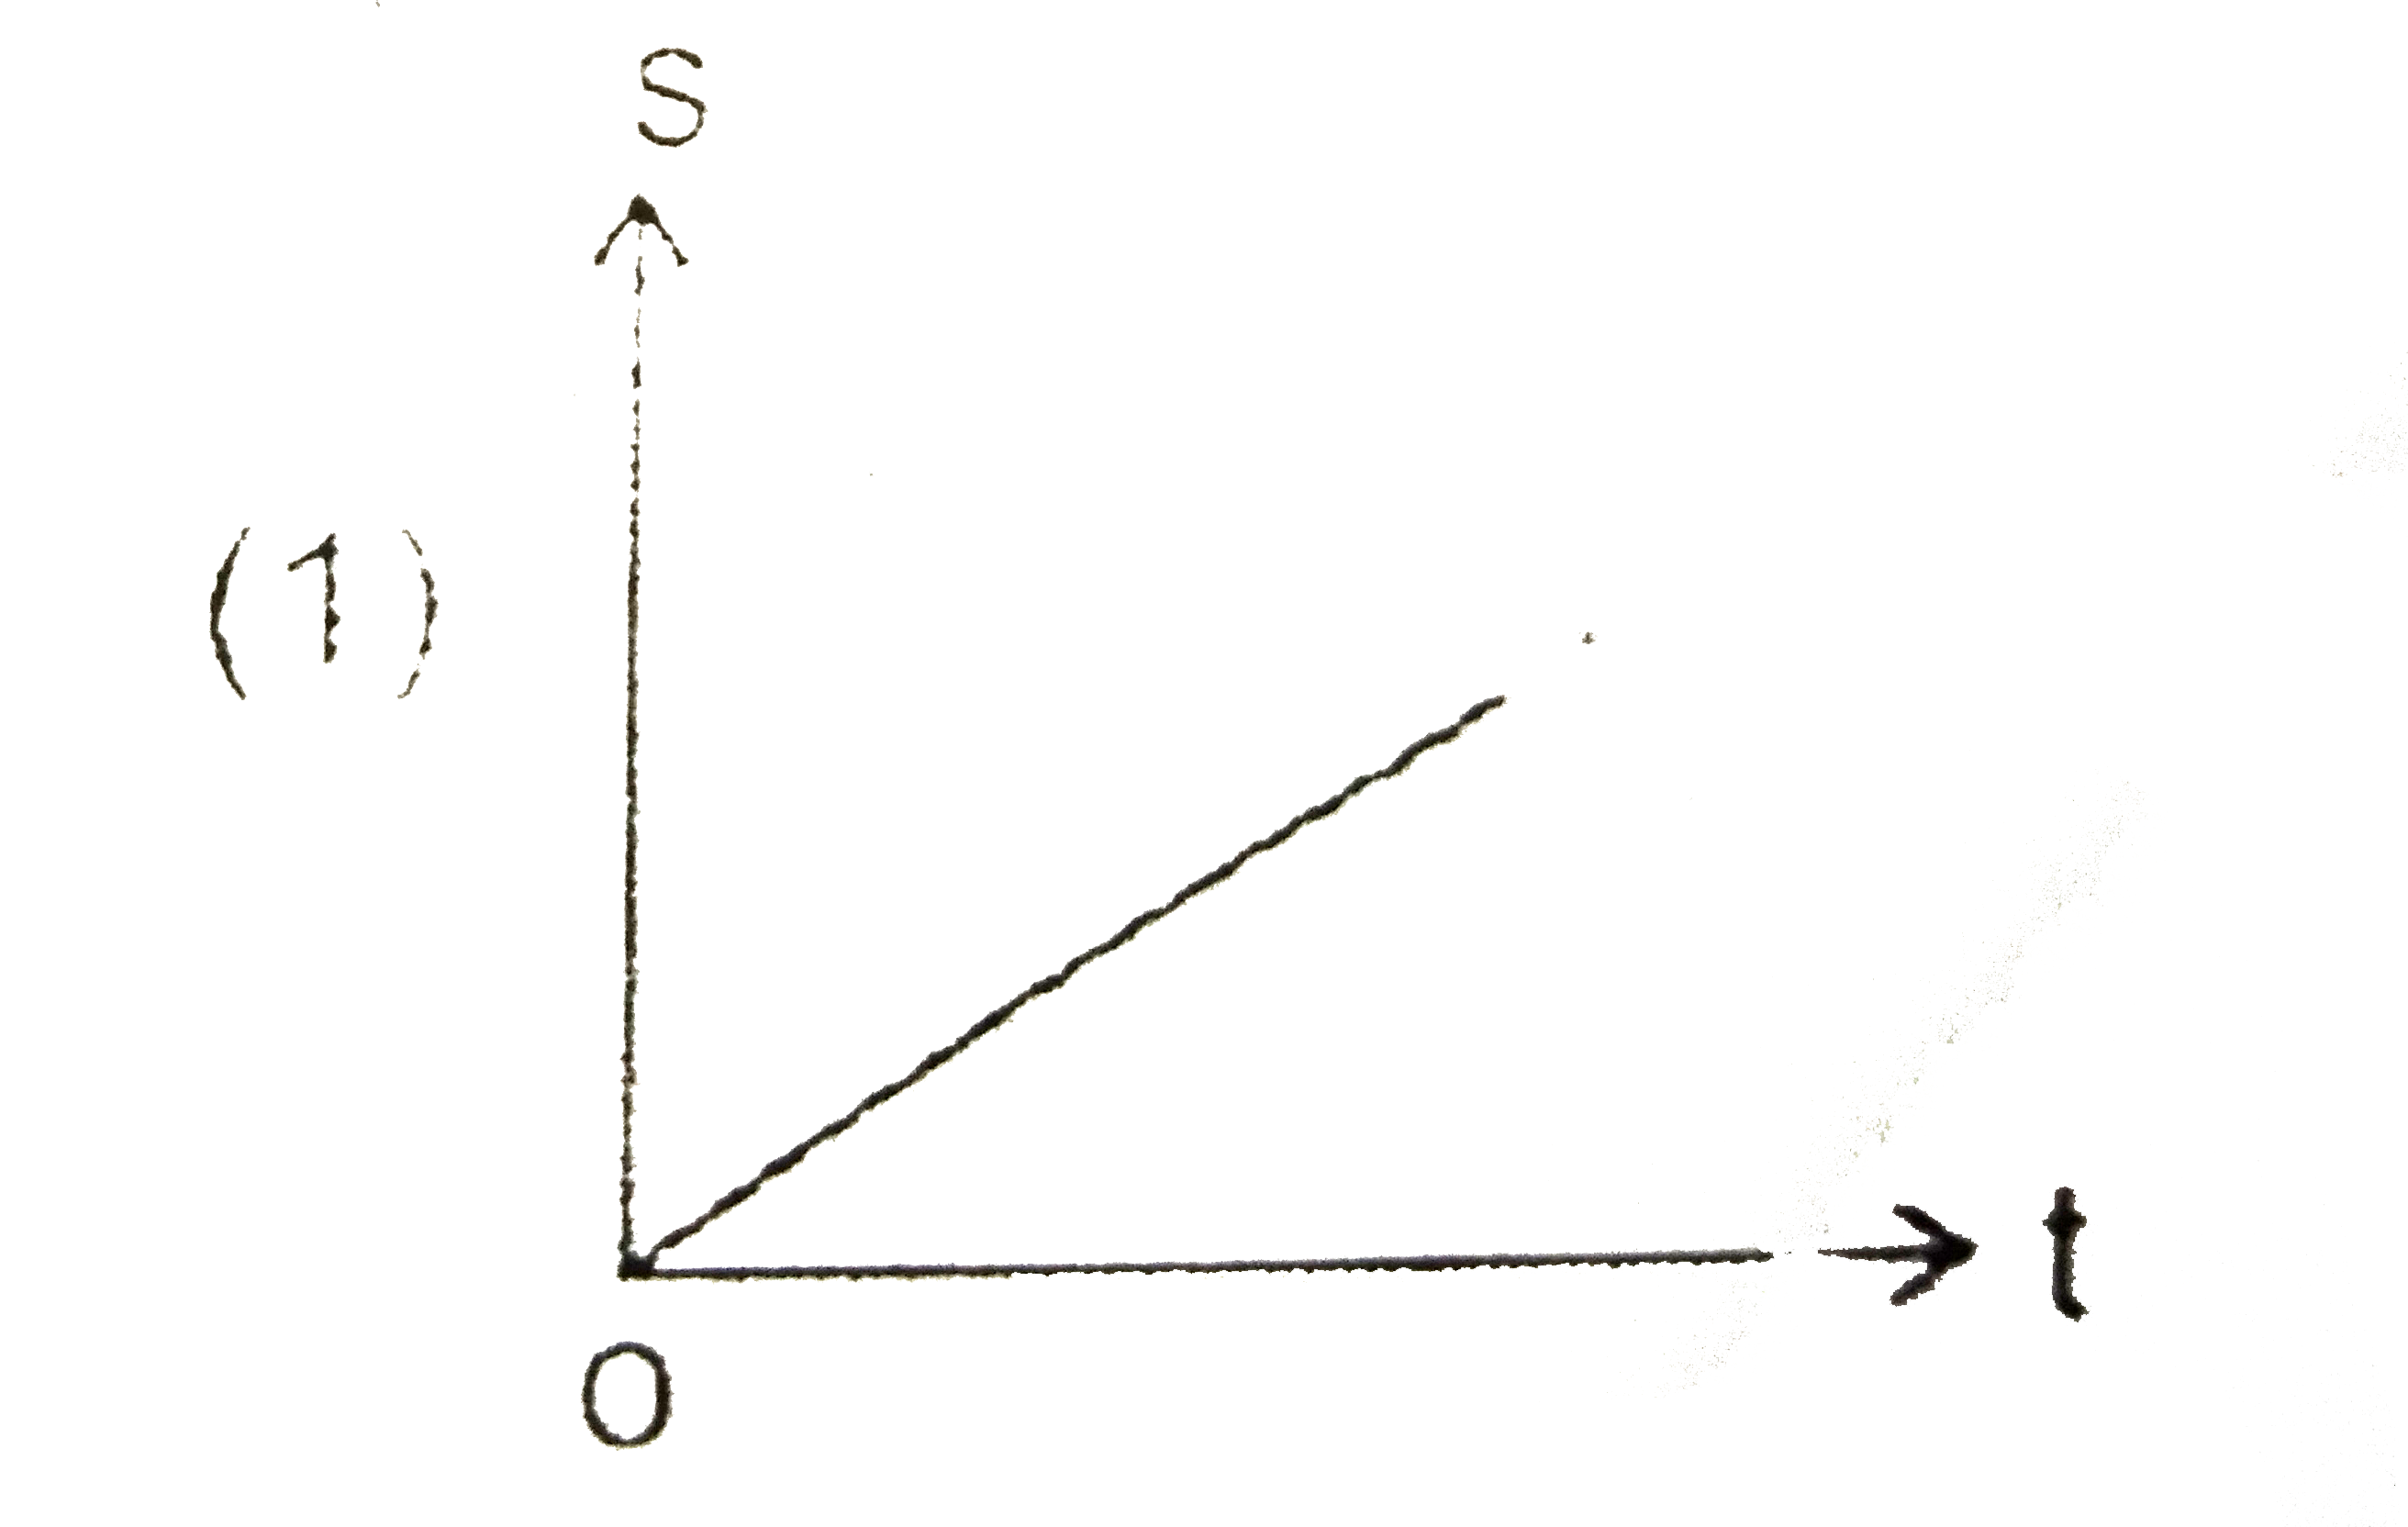 B
B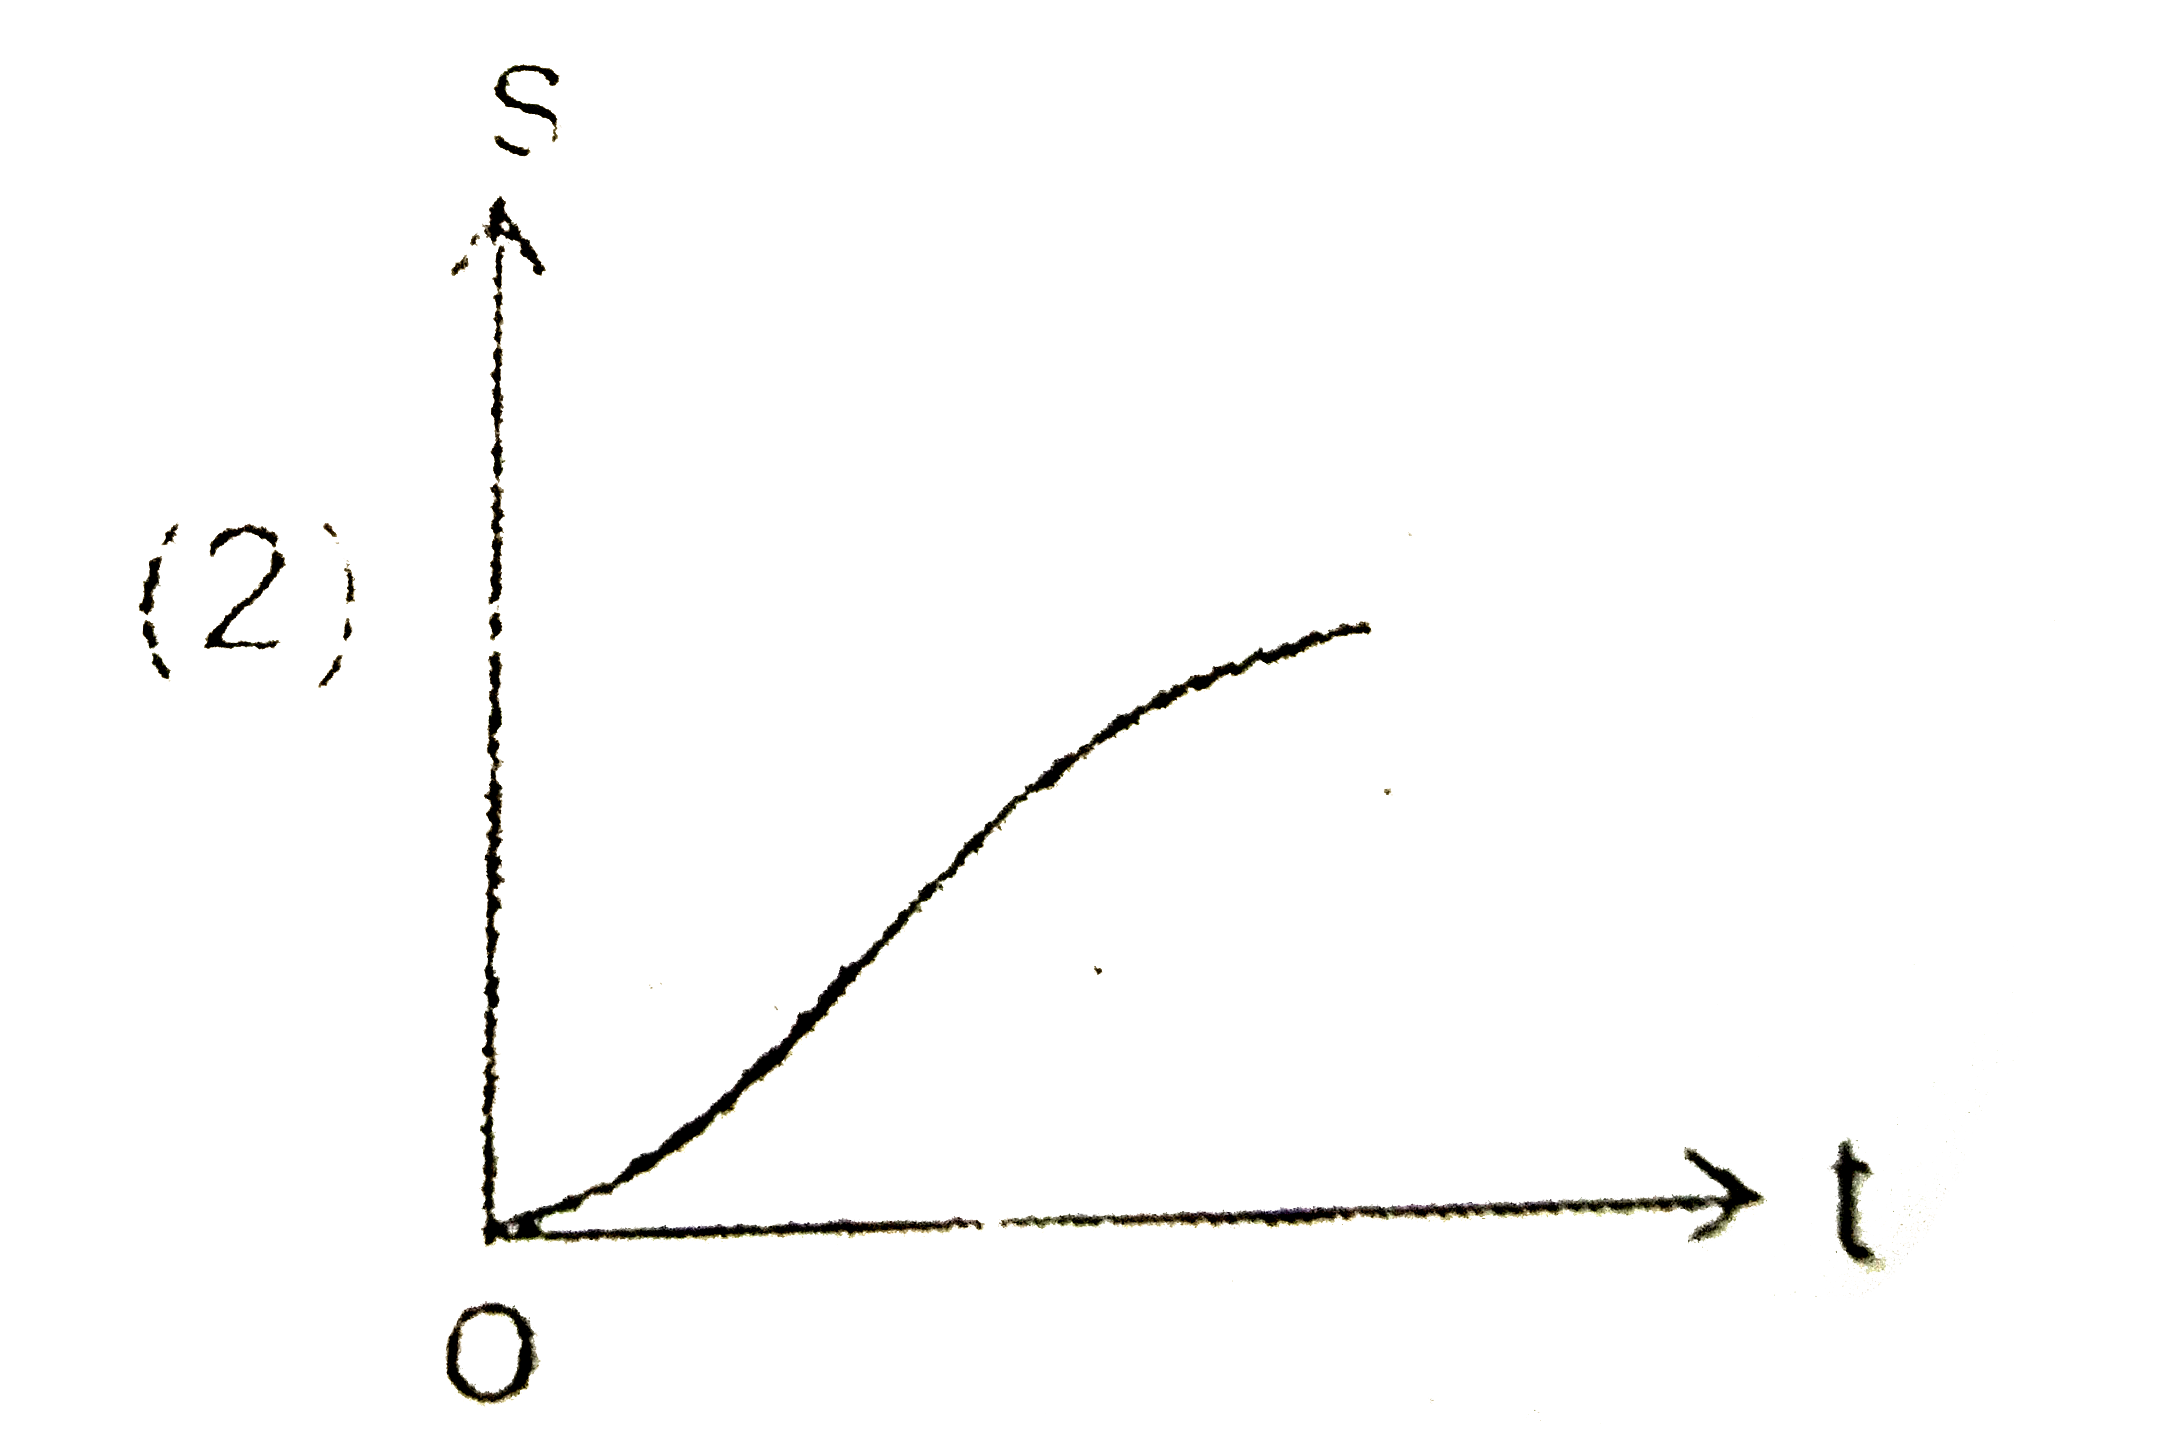 C
C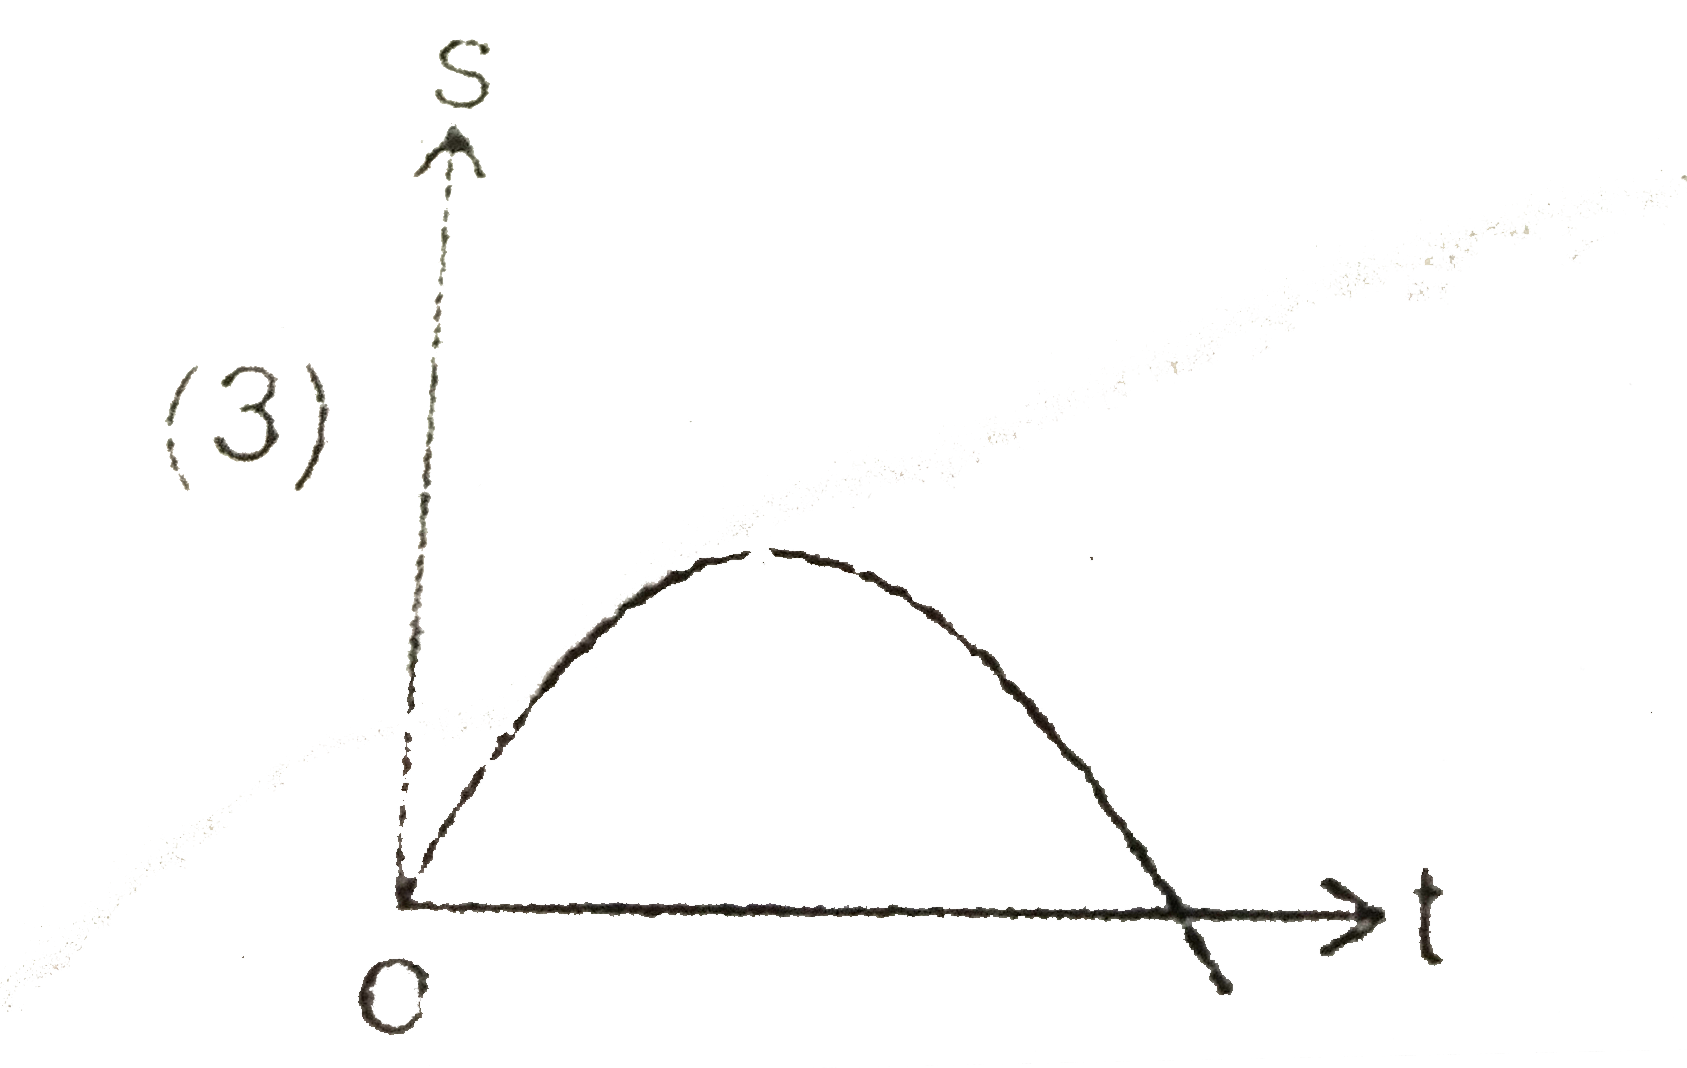 D
D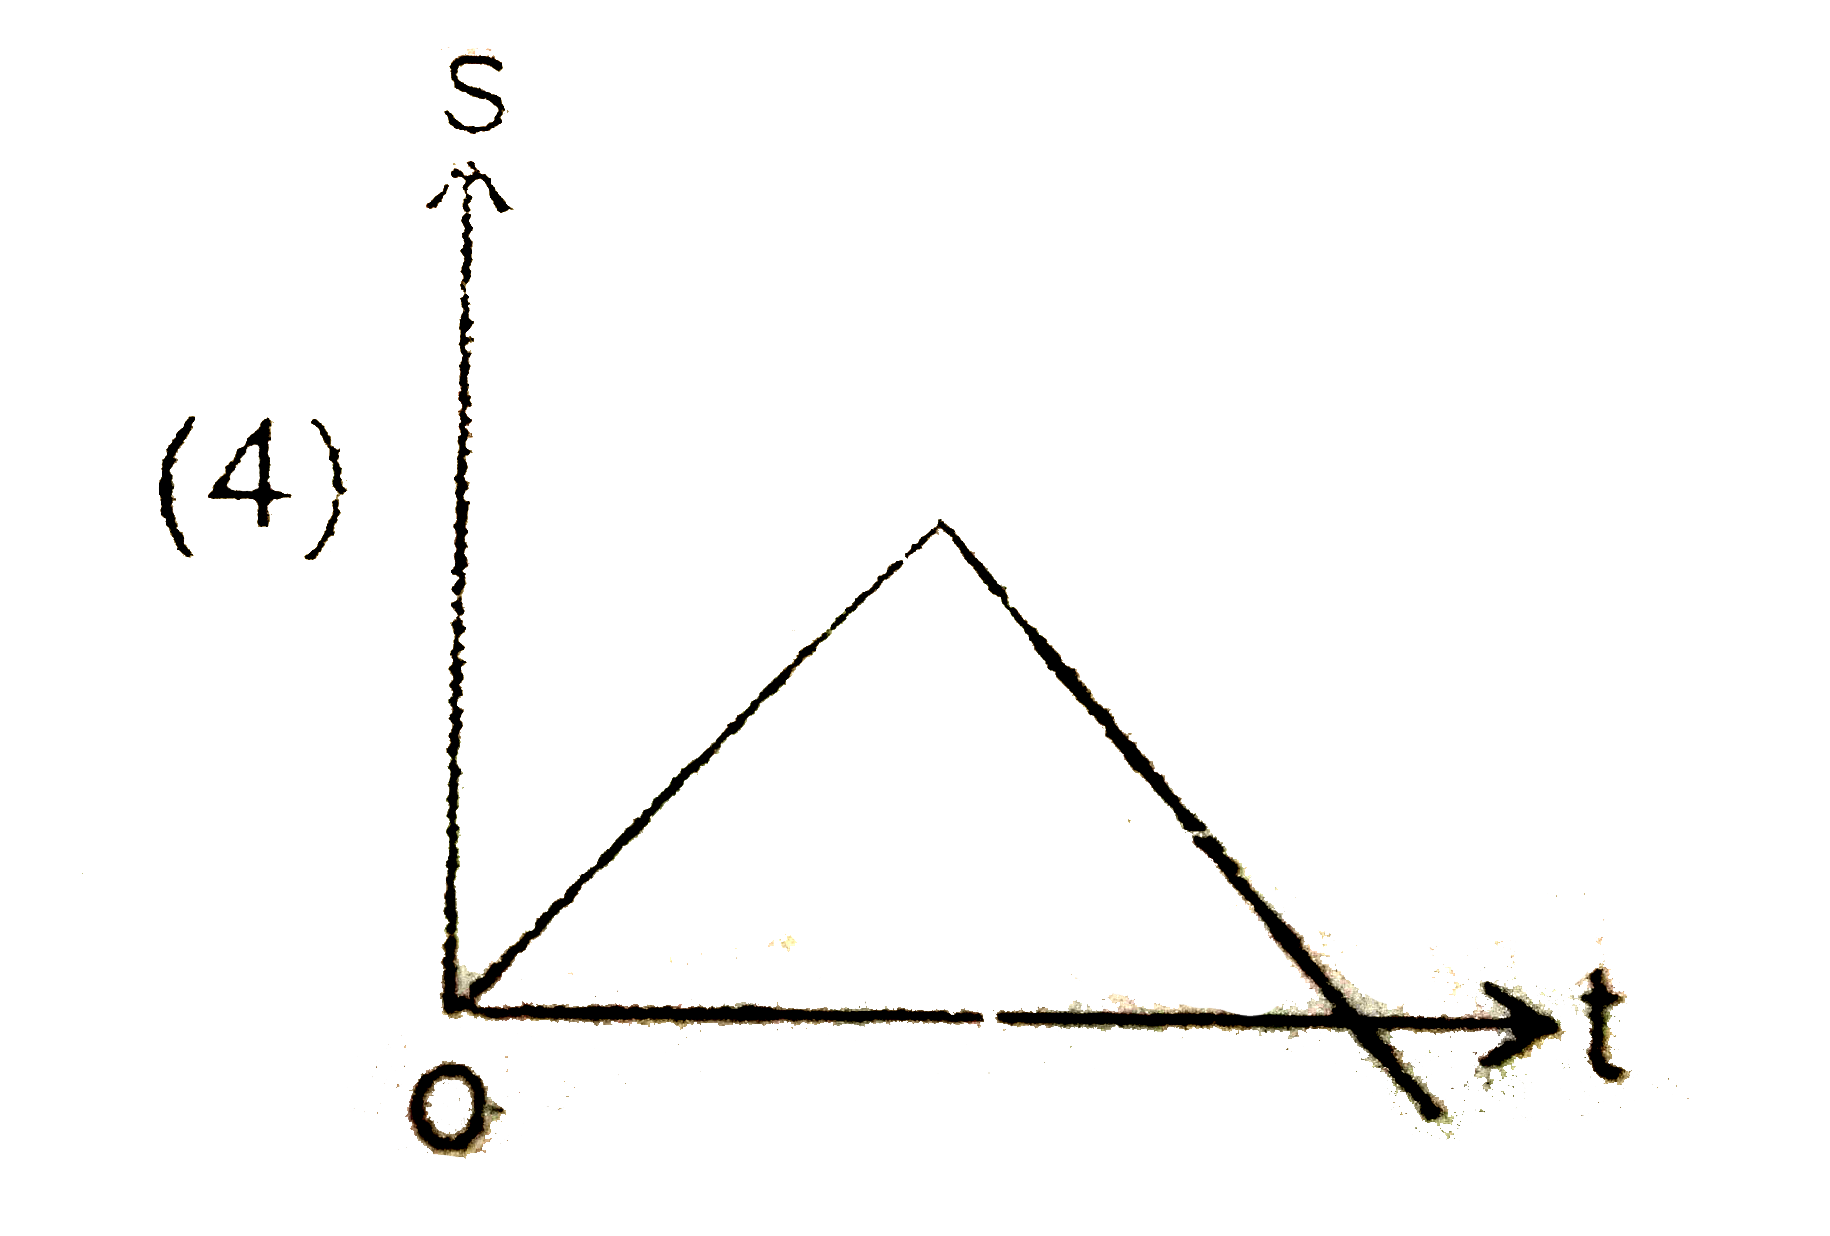
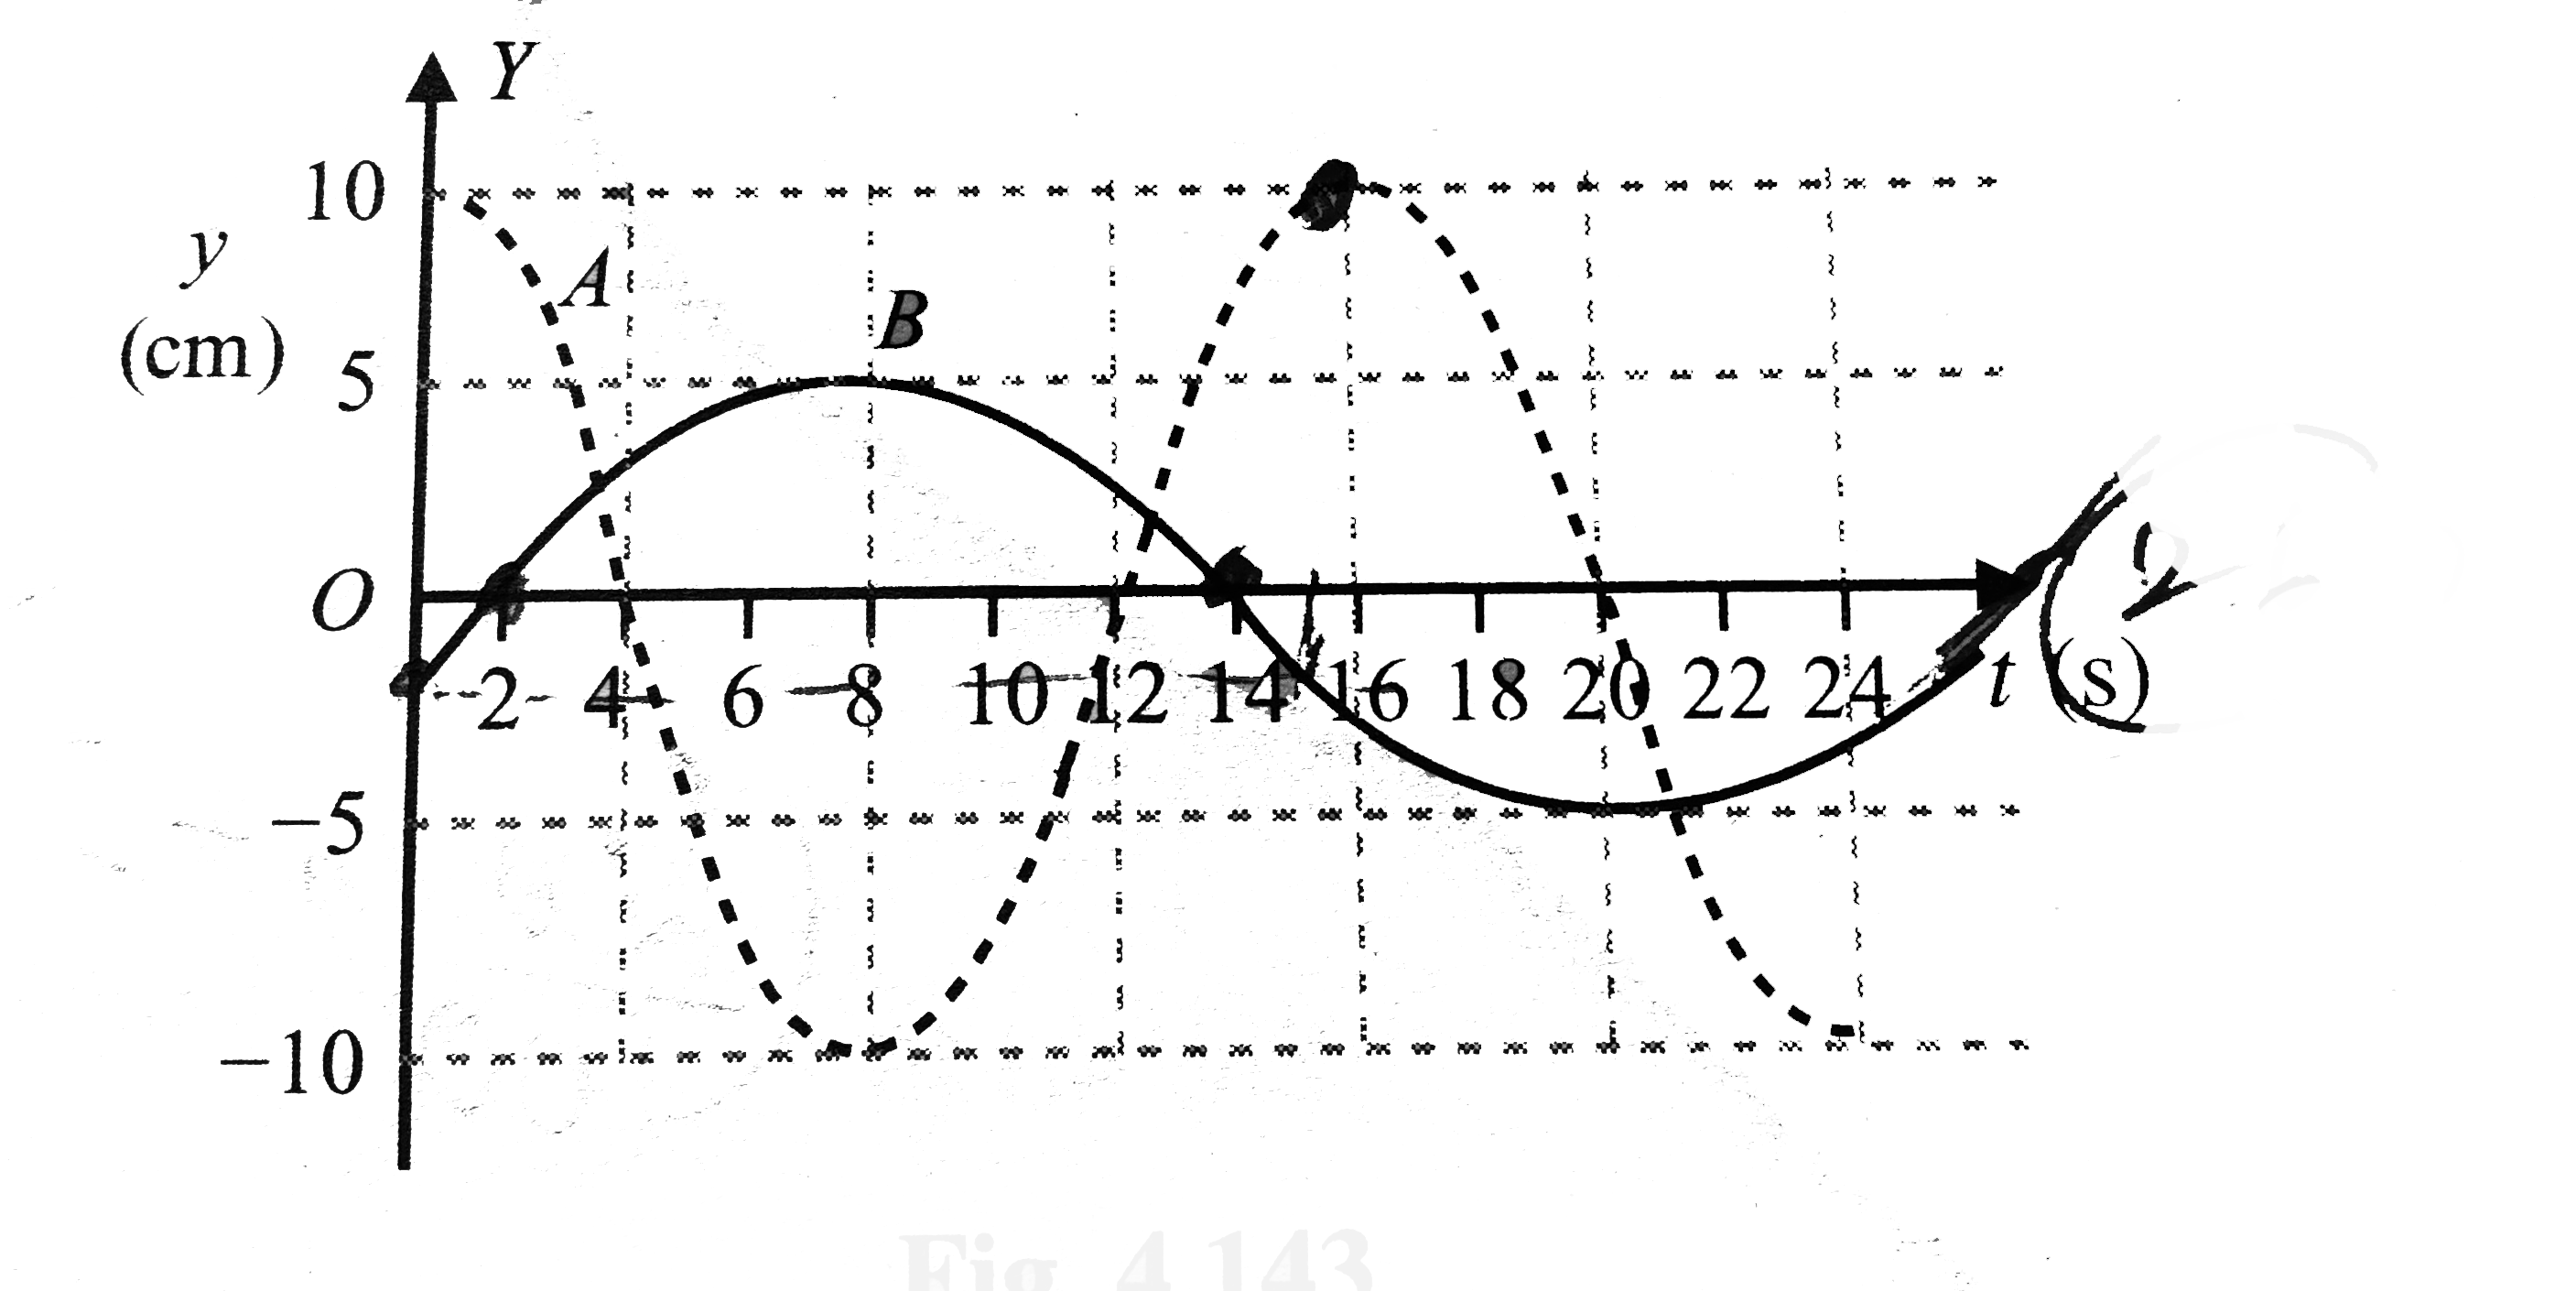
The following figure shows the displacement versus time graph for two particles A and B executing simple harmonic motions. The ratio of their maximum velocities isA3:1B1:3C1:9D9:1
i.The acceleration versus time graph of a partical SHM is shown in the figure . Plot the displacement versus time graph
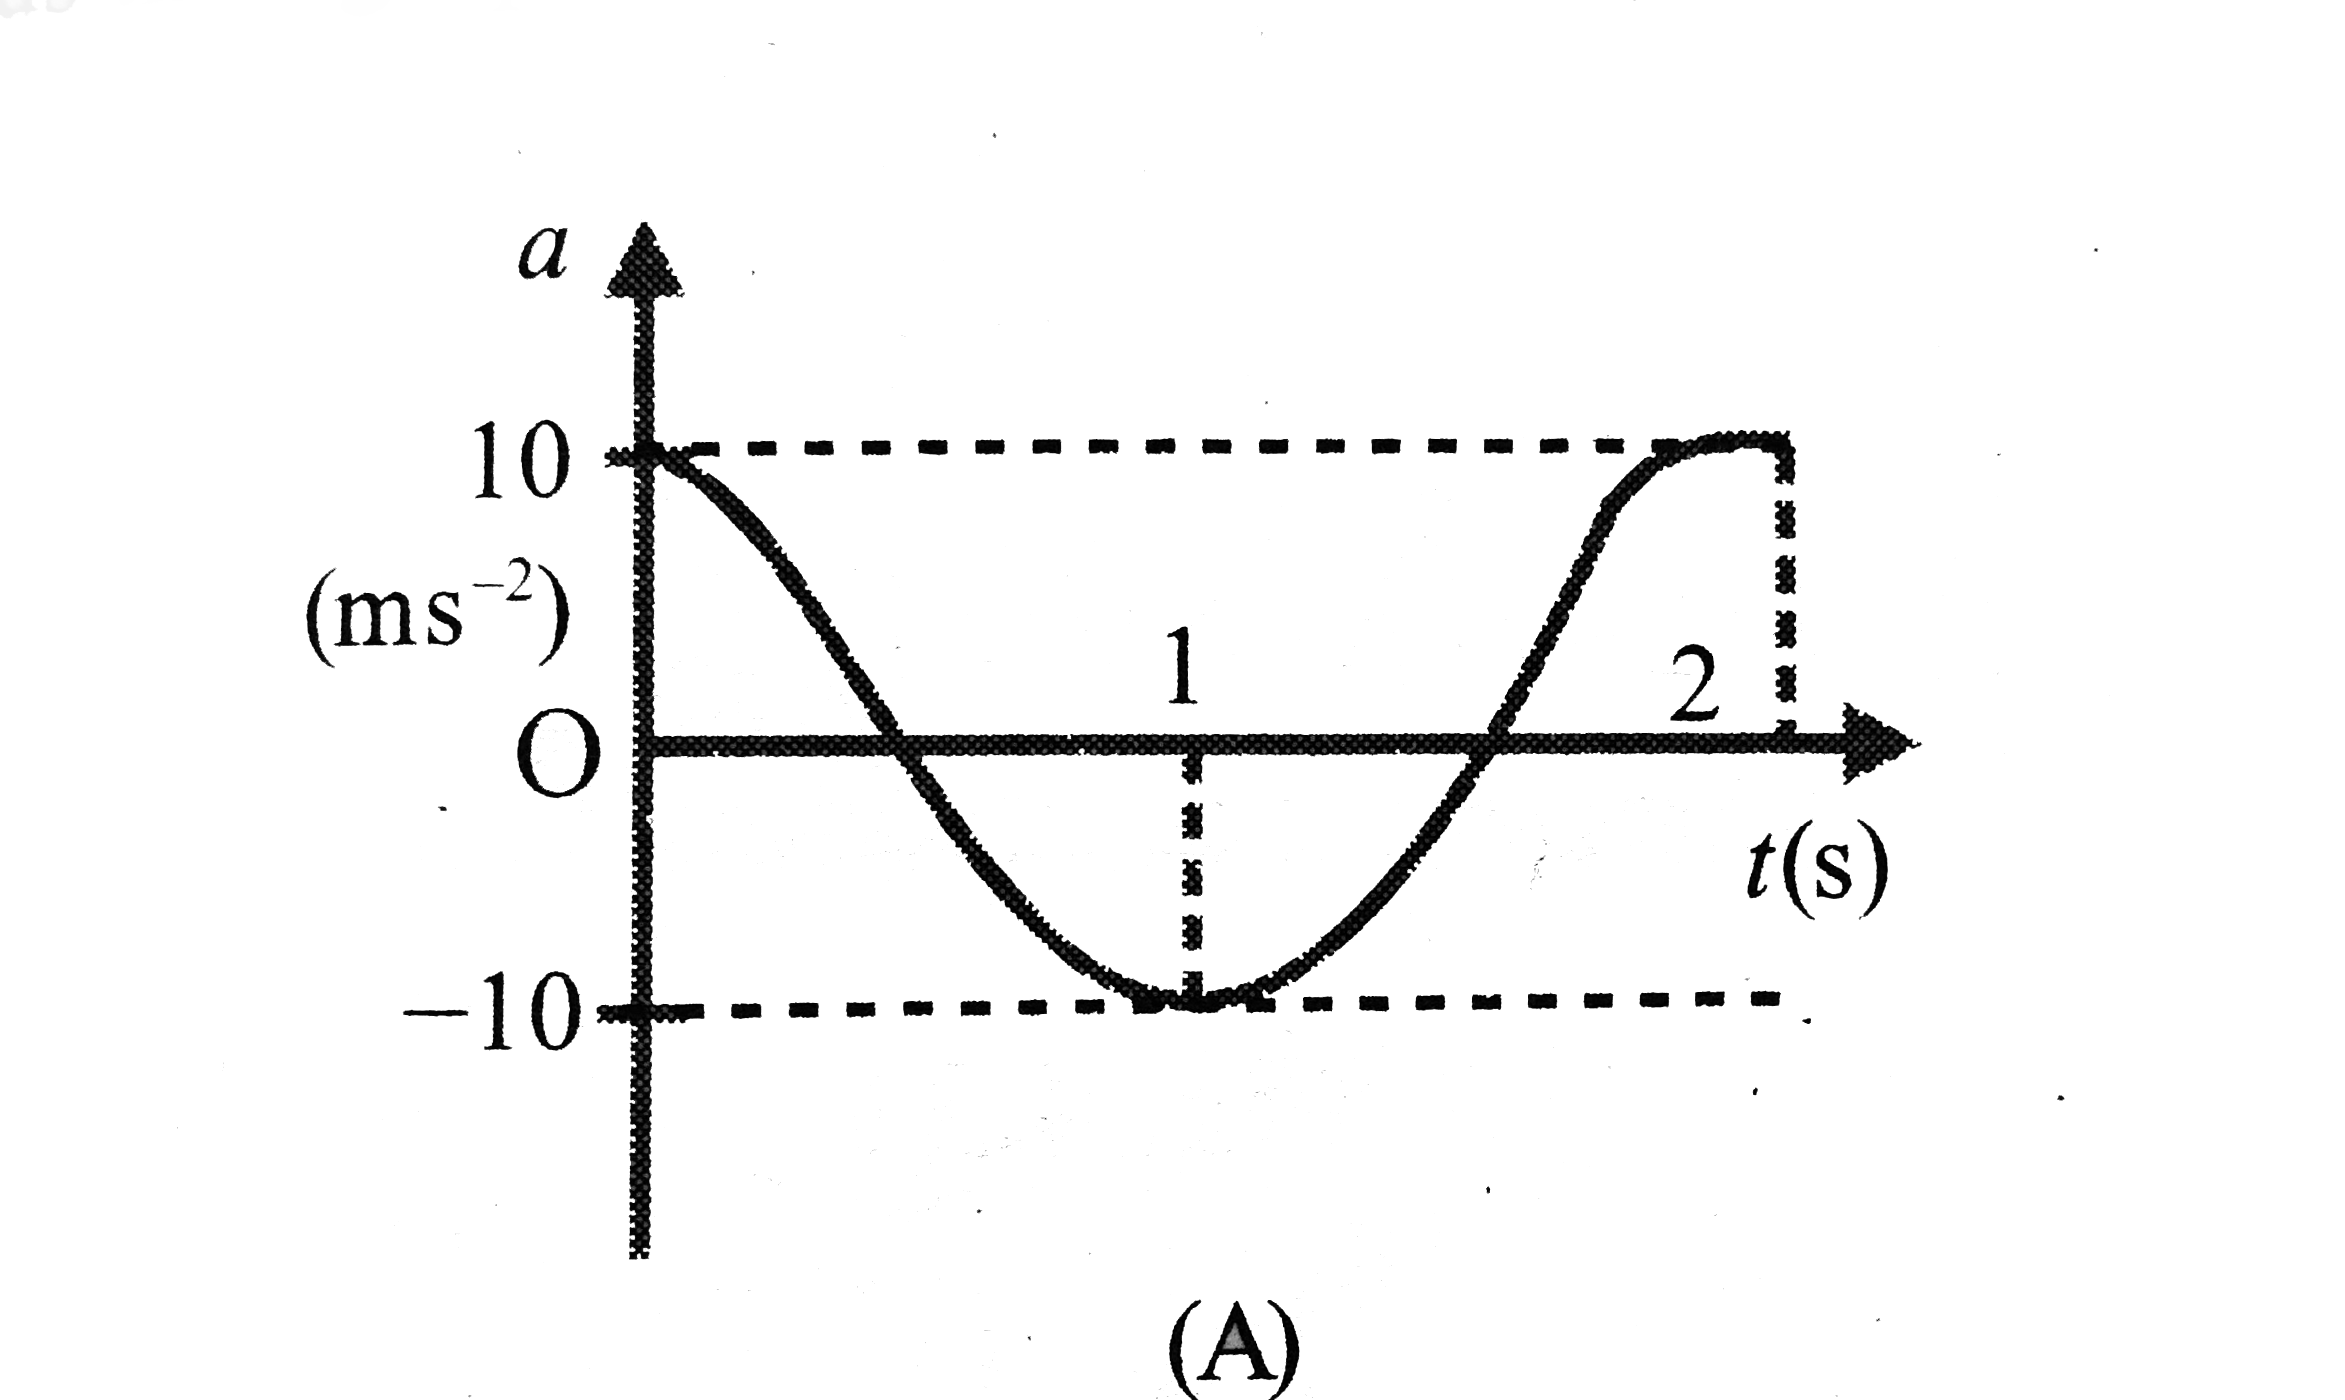
ii. The frection of oscillation is……..
iii. The displacement amplitude is ………
iv. At t=0, the velocity of the partical is ......
v. The kinetic energy of the partical is maximum at t=....... and t = ......
vi. The potential energy is maximum at t = ....... : t = ..... ans t = .........
View SolutionThe figure gives the displacement versus time graph of a simple harmonic oscillator. The position with maximum speed directed down wards is at

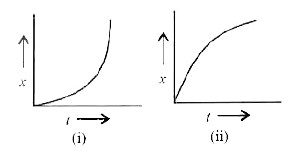
View SolutionFigure (i) and (i) show the displacement-time graphs of two particles moving along the x-axis. We can say that
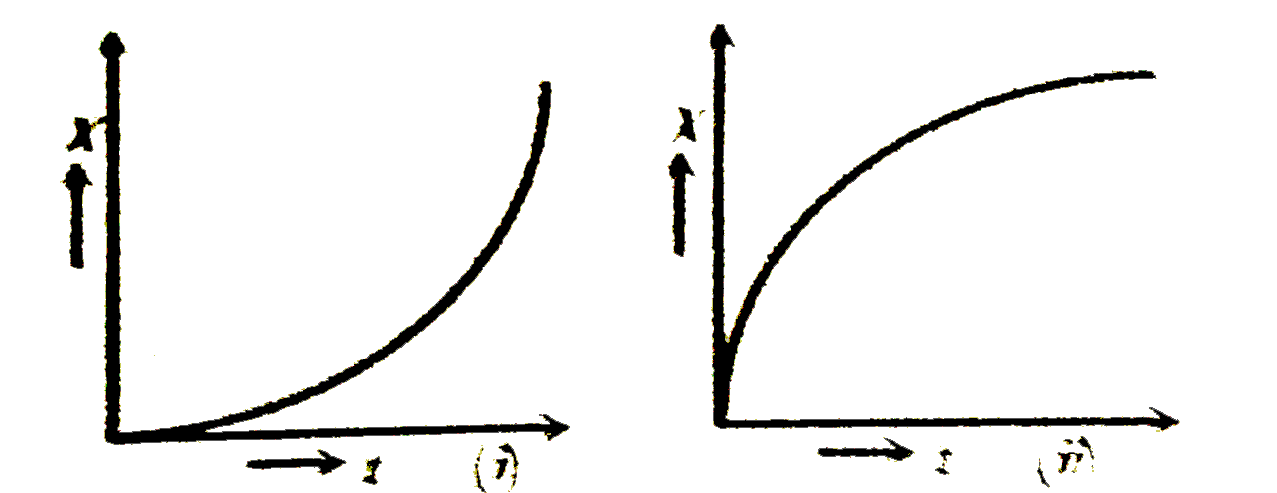
View SolutionFigures (i) and (ii) below show the displacement-time graphs of two particles moving along the x -axis. We can say that
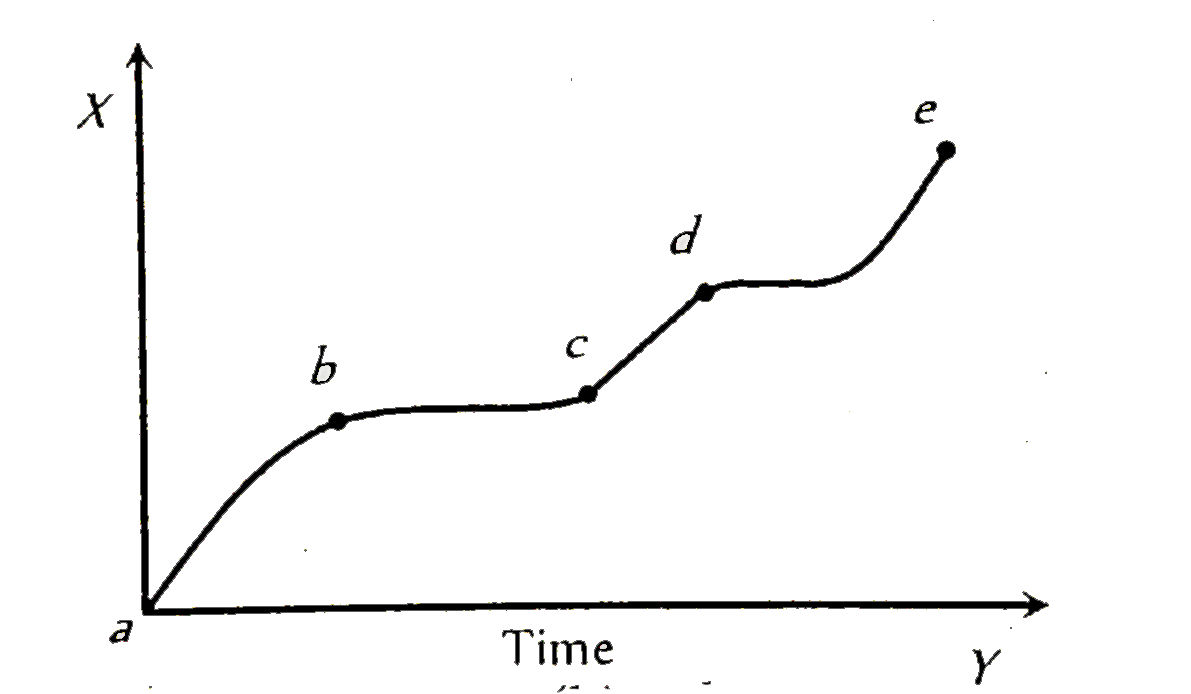
View SolutionThe displacement versus time graph for a body moving in a straight line is shown in figure. Which of the following regions represents the motion when no force is acting on the body
View Solution


