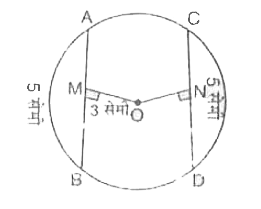
दी गई आकृति में AB=CD=5 सेमी| OM = 3 सेमी तब ON की लम्बाई है:

4 सेमी
6 सेमी
1.5 सेमी
3 सेमी |
The correct Answer is:D
Step by step video, text & image solution for दी गई आकृति में AB = CD = 5 सेमी| OM = 3 सेमी तब ON की लम्बाई है: by Maths experts to help you in doubts & scoring excellent marks in Class 9 exams.
Topper's Solved these Questions
- BOOK - MBD HINDI-HARYANA BOARDCHAPTER - वृत्त EXERCISE - अभ्यास के लिए प्रश्न (दीर्घ उत्तरात्मक प्रश्न)10videos
वृत्त
- BOOK - MBD HINDI-HARYANA BOARDCHAPTER - रेखाएँ और कोण EXERCISE - दीर्घ उत्तरीय प्रश्न1videos
रेखाएँ और कोण
- BOOK - MBD HINDI-HARYANA BOARDCHAPTER - संख्या पद्धति EXERCISE - बहुविकल्पी प्रश्न22videos
संख्या पद्धति
Similar Questions
सिद्ध कीजिए कि एक चाप द्वारा केंद्र पर आंतरित कोण वृत्त के शेष भाग के किसी बिंदु पर अंतरित कोण का दुगुना होता है|
अतः, एक चक्रीय चतुर्भुज ABCD जिसमें AB = AC = AD है| सिद्ध कीजिए कि ∠BAD=2(∠CBD+∠CDB).03:26View Solutionयदि दो रेखाएँ परस्पर प्रतिच्छेद करें, तो शीर्षभिमुख कोण समान होते हैं।
01:37View Solutionपरिमेय संख्या 340 बराबर है |
06:07View SolutionIn the given figure (not to scale), O is the centre of the circle. A,B,C and D are concyclic and AB=CD . If /_MON =120^(@) , then find /_ OPN .
02:11View SolutionHow many lines of symmetry does the above figure have ?
01:31View SolutionWhich of the following are correct chain isomers of butane ? (i)
02:46View SolutionDetermine the point of symmetry of a regular hexagon.
02:45View SolutionDtermine the images of the following figure about the given line :
02:17View SolutionIn the figure above (not to scale), ¯¯¯¯¯¯AB⊥¯¯¯¯¯¯CDandAD is the bisector of ∠BAE.AB=3cm and AC=5cm. Find CD.
05:41View SolutionMatch the following Column A to Column B
 02:21View Solution
Match the following Column A to Column B
 02:03View Solution
Match the following Column A to Column B
 02:10View Solution
Find the area of the figure given below.
 02:17View Solution
The area of the shaded part in the figure given below is ______.
 02:10View Solution
The inequation represented by the graph given below is :
04:23View SolutionThe inequation that best describes the graph given below is _________
01:13View Solution

