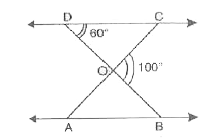
दी गई आकृति में , ΔODC~ΔOBA∠BOC=100∘∠ODC=60∘ तो ∠OAB का मान है :

(A) 20∘
(B) 80∘
(C) 60∘
(D) 40∘
[ HB 2017 Set A ]
The correct Answer is:D
Step by step video, text & image solution for दी गई आकृति में , DeltaODC ~ DeltaOBA angleBOC = 100^@ angleODC = 60^@ तो angleOAB का मान है : by Maths experts to help you in doubts & scoring excellent marks in Class 10 exams.
Topper's Solved these Questions
- BOOK - MBD HINDI-HARYANA BOARDCHAPTER - त्रिभुजEXERCISE - प्रश्न11videos
त्रिभुज
- BOOK - MBD HINDI-HARYANA BOARDCHAPTER - त्रिकोणमिति के कुछ अनुप्रयोग EXERCISE - बहुविकल्पी प्रश्न7videos
त्रिकोणमिति के कुछ अनुप्रयोग
- BOOK - MBD HINDI-HARYANA BOARDCHAPTER - दो चर वाले रैखिक समीकरण युग्म EXERCISE - लघु उत्तरात्मक प्रश्न21videos
दो चर वाले रैखिक समीकरण युग्म
Similar Questions
किसी त्रिभुज में , एक भुजा के समांतर अन्य दो भुजाओं को भिन्न - भिन्न बिंदुओं पर प्रतिच्छेद करने के लिए , एक रेखा खींची जाए , तो यह अन्य दो भुजाओं को एक ही अनुपात में विभाजित करती है । सिद्ध कीजिए ।
01:37View Solutionपहाड़ी के शिखर से उसके पाद के 40 किमी दूरी का अवनमन कोण 45∘ है । पहाड़ी की ऊँचाई होगी :
( A ) 30 किमी ( B ) 35 किमी
( C ) 40 किमी ( D ) 45 किमी ।06:07View Solutionनिम्न रैखिक समीकरण के युग्म को हल कीजिए ।
2x+3y=13
5x−4y=−202:11View SolutionHow many lines of symmetry does the above figure have ?
01:31View SolutionWhich of the following are correct chain isomers of butane ? (i)
02:45View SolutionDetermine the point of symmetry of a regular hexagon.
02:17View SolutionDtermine the images of the following figure about the given line :
05:41View SolutionMatch the following Column A to Column B
 02:21View Solution
Match the following Column A to Column B
 02:03View Solution
Match the following Column A to Column B
 02:10View Solution
Find the area of the figure given below.
 02:17View Solution
The area of the shaded part in the figure given below is ______.
 02:10View Solution
The inequation represented by the graph given below is :
04:23View SolutionThe inequation that best describes the graph given below is _________
01:13View SolutionThe inequation that best describes the following graph is _________
03:12View SolutionWhich inequations represent the shaded region in the given figure
05:46View Solution

