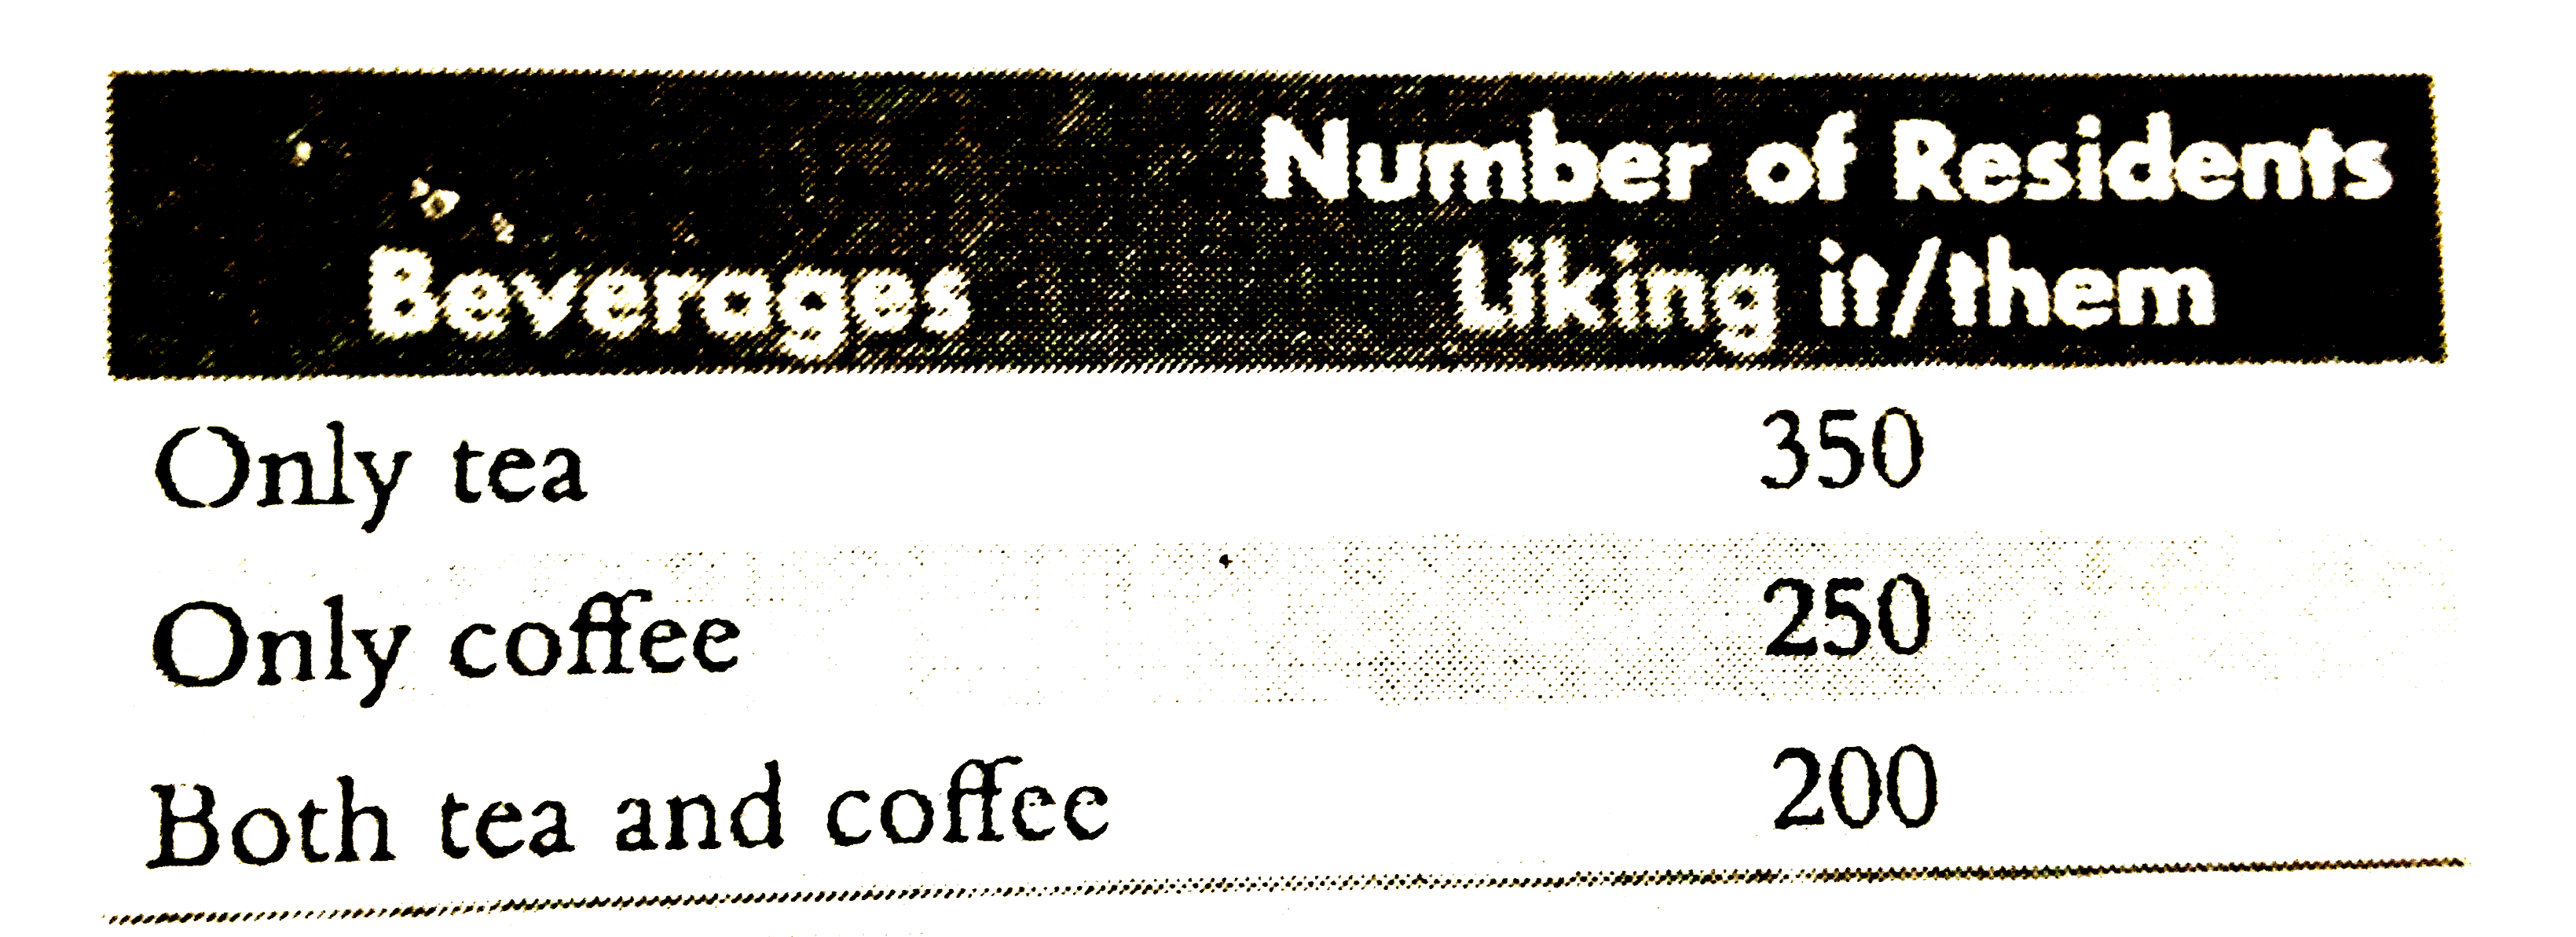
In City X, there were 900 residents. A survey was conducted in it reagrding the favourite beverages of the residents. The results of the survey are partially conveyed in the table below.

Find the probability that a resident chosen at random likes only tea or only coffee.
23
59
79
49
The correct Answer is:A
Required probability = Probability (resident liking only tea) + probability (resident liking only coffee)
=350900+250900=600900=23.
Topper's Solved these Questions
- BOOK - PEARSON IIT JEE FOUNDATIONCHAPTER - PROBABILITYEXERCISE - LEVEL 38videos
PROBABILITY
- BOOK - PEARSON IIT JEE FOUNDATIONCHAPTER - PROBABILITYEXERCISE - LEVEL 110videos
PROBABILITY
- BOOK - PEARSON IIT JEE FOUNDATIONCHAPTER - POLYNOMIALS AND SQUARE ROOTS OF ALGEBRAIC EXPRESSIONSEXERCISE - Level 310videos
POLYNOMIALS AND SQUARE ROOTS OF ALGEBRAIC EXPRESSIONS
- BOOK - PEARSON IIT JEE FOUNDATIONCHAPTER - QUADRATIC EXPRESSIONS AND EQUATIONSEXERCISE - Level 323videos
QUADRATIC EXPRESSIONS AND EQUATIONS
Similar Questions
To know the opinion of the students about the subject statistics, a survey of 200 students was conducted. The data is recorded in the following table.

Find the probability that a student chosen at random
likes statisticsView SolutionTo know the opinion of the students about the subject statistics, a survey of 200 students was conducted. The data is recorded in the following table.

Find the probability that a student chosen at random
does not like it.View SolutionTo know about the liking of Science as a subject , a survey of 200 students was conducted and the data obtained is given below :
Liking - 125, Disliking - 75
Find the probability that a student chosen at random
likes Science as a subjectView SolutionKnow the opinion of the students about Mathematics, a survey of 200 students was conducted. The data is recorded in the following table: Opinion: Like Dislike Number of Students: 135 65 Find the probability that a student chosen at random (i) likes Mathematics (ii) does not like it.
View SolutionTo know about the liking of Science as a subject , a survey of 200 students was conducted and the data obtained is given below :
Liking - 125, Disliking - 75
Find the probability that a student chosen at random
does not like Science as a subjectView SolutionTo know the opinion of the students about Mathematics, a survey of 200 students was conducted. The data is recorded in the following table: Opinion: Like Dislike No. of students 135 65 Find the probability that a student chosen at random (i) like Mathematics (ii) does not like it.
View SolutionTo know the opinion of the students about the subject statistics , a survey of 200 students was conducted . The data is recorded in the following table :
Opinion Number of studentsLike135Dislike65
Find the probability that a student chosen at random
Likes statisticsView SolutionTo know the opinion of the students about the subject statistics , a survey of 200 students was conducted . The data is recorded in the following table :
Opinion Number of studentsLike135Dislike65
Find the probability that a student chosen at random
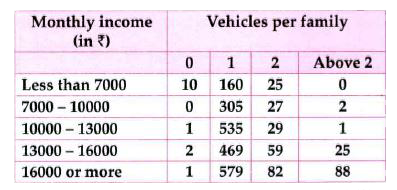
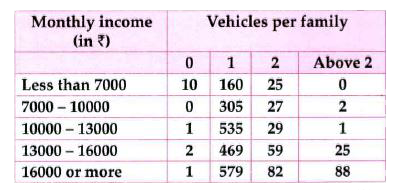
Does not like it.View SolutionAn organisation selected 2400 families at random and surveyed them to determine a relationship between income level and the number of vehicles in a family. The information gathered is listed in the table below.

Suppose a family is chosen. Find the probability that the family chosen is
earning Rs 16000 or more per month and owning exactly 1 vehicle.View SolutionAn organisation selected 2400 families at random and surveyed them to determine a relationship between income level and the number of vehicles in a family. The information gathered is listed in the table below.

Suppose a family is chosen. Find the probability that the family chosen is
earning less than RS 7000 per month and does not own any vehicleView Solution

