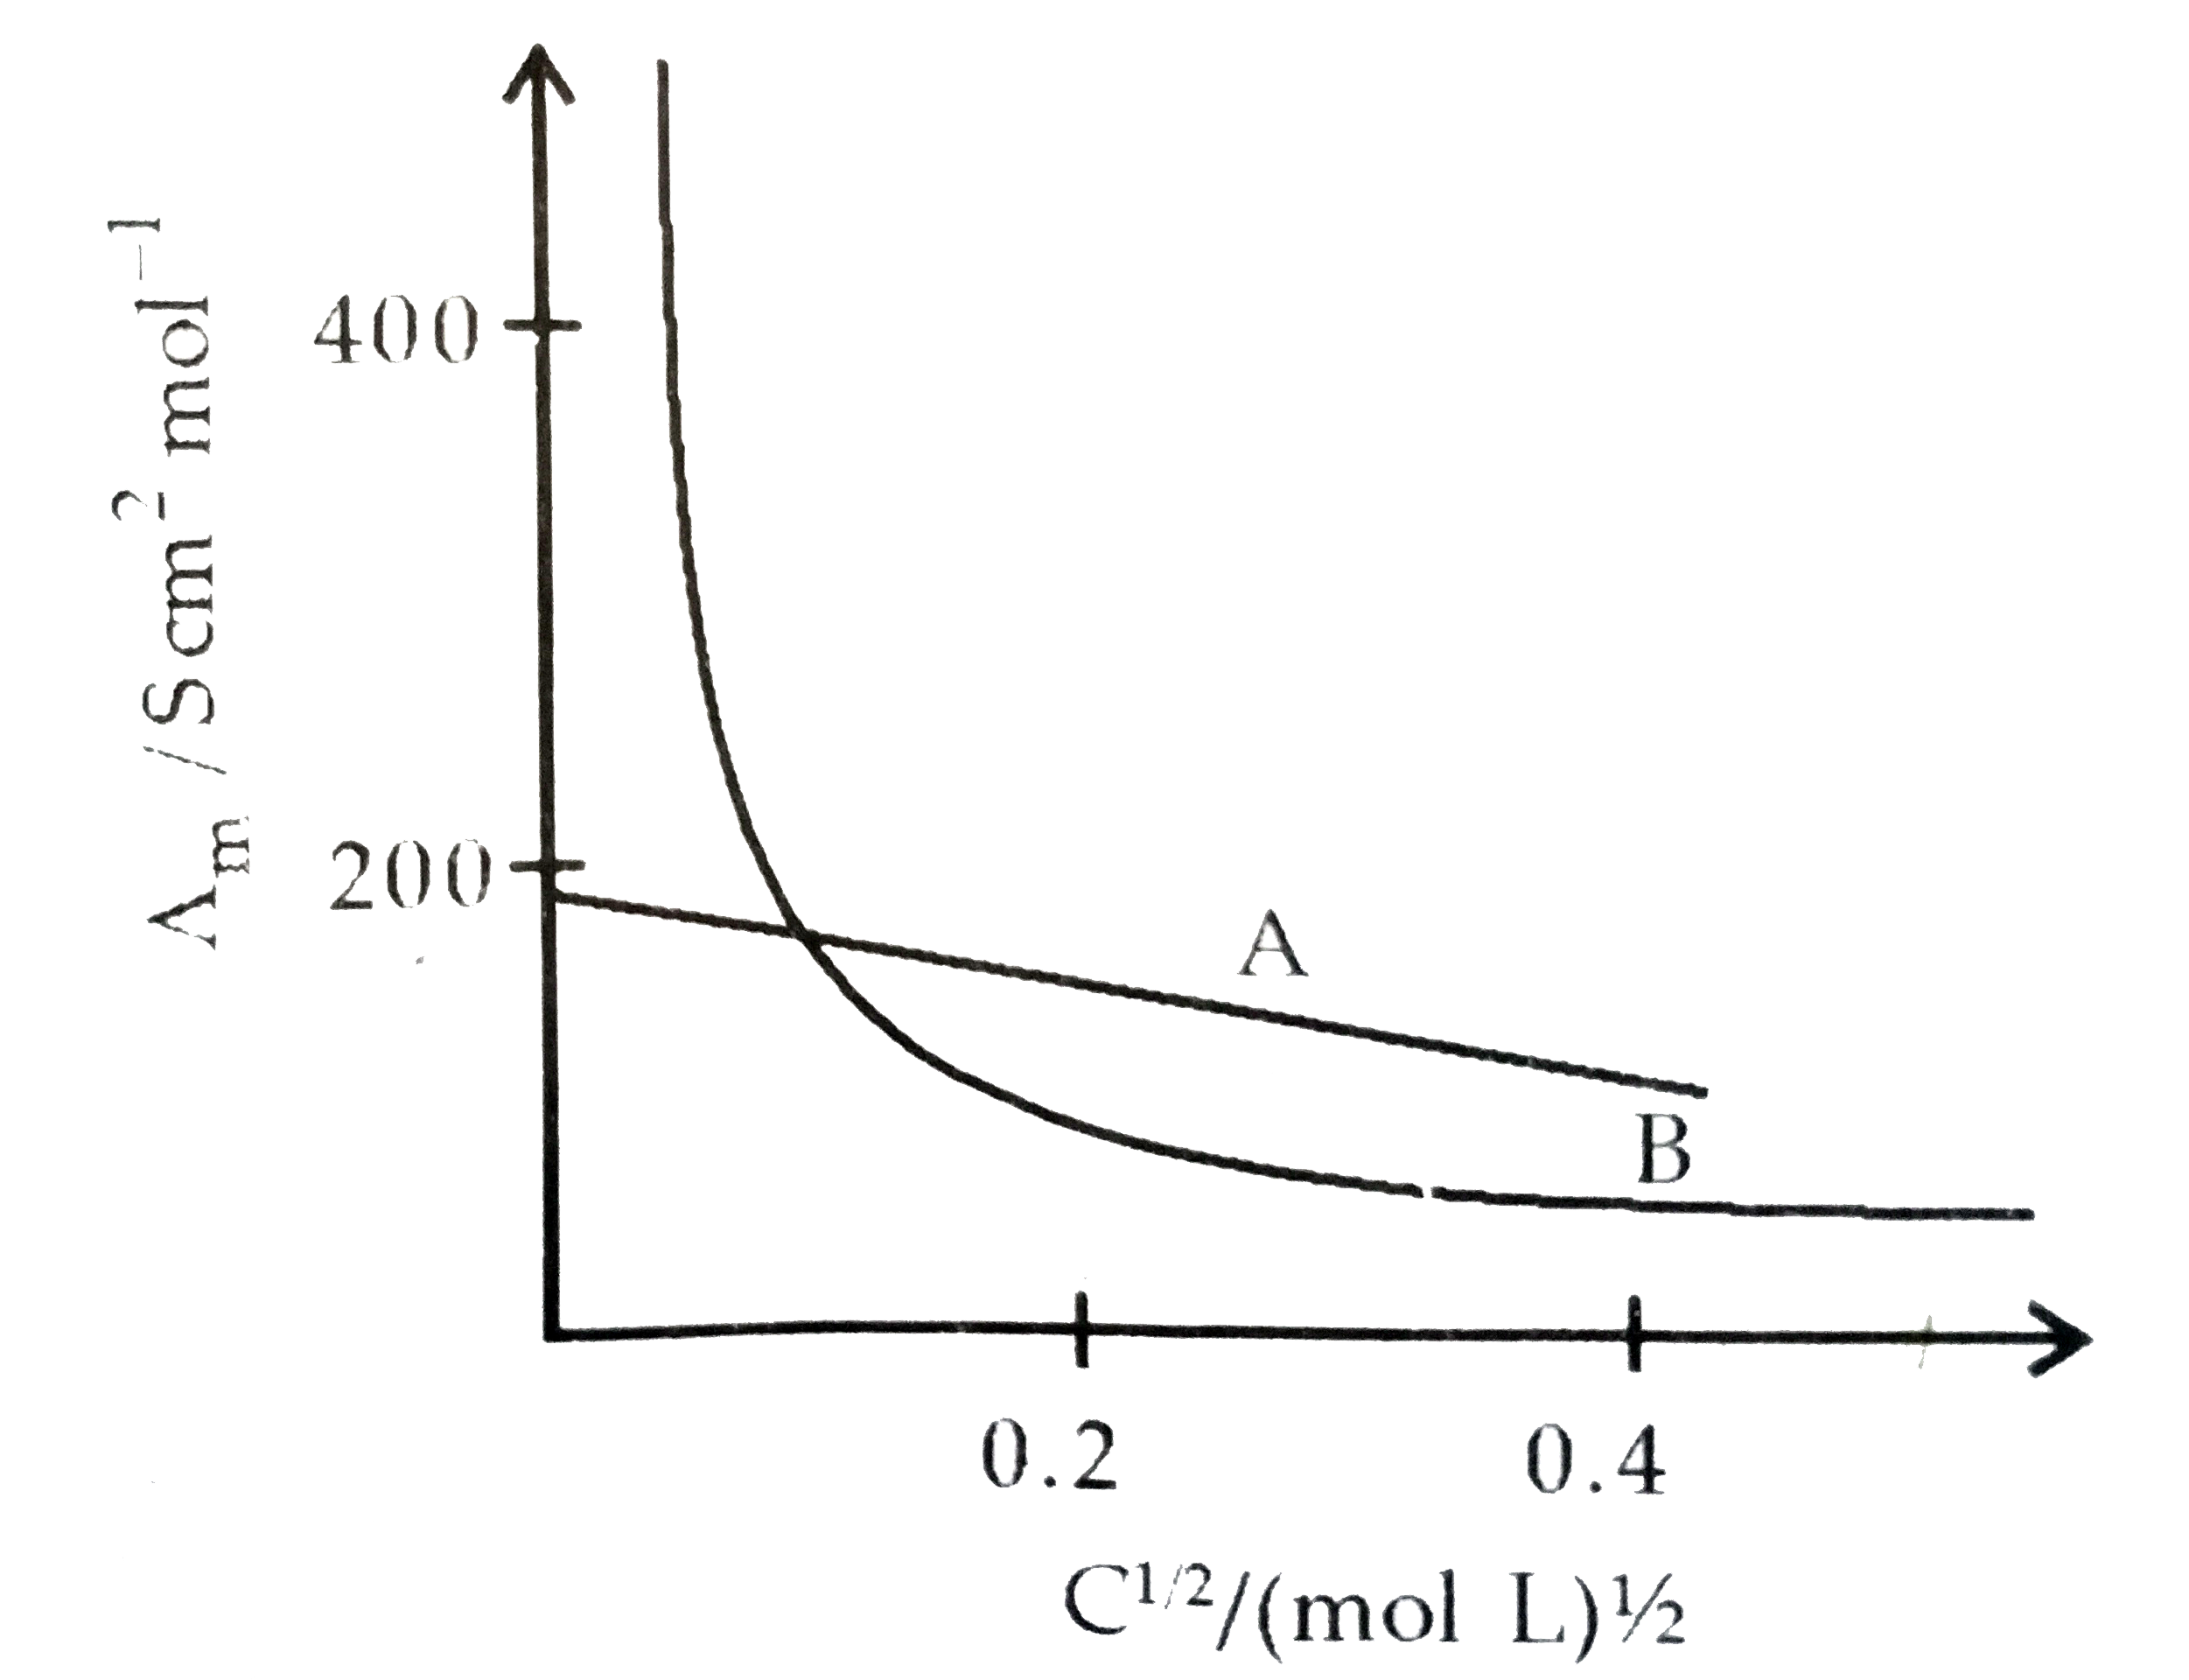
The following curve is obtained when molar conductivity (∧m) is plotted against the square root of concentration, c1/2 for two electrolytes A and B
(a) How do you account for the increase in the molar conductivity of the electrolyte A on dilution.

(b) As seen from the graph, the value of limiting molar conductivity (∧0m) for electrolyte B cannot be obtained graphically. How can this value be obtained?1
Step by step video & image solution for The following curve is obtained when molar conductivity (wedge_(m)) is plotted against the square root of concentration, c^(1//2) for two electrolytes A and B (a) How do you account for the increase in the molar conductivity of the electrolyte A on dilution. (b) As seen from the graph, the value of limiting molar conductivity (wedge_(m)^(0)) for electrolyte B cannot be obtained graphically. How can this value be obtained?1 by Chemistry experts to help you in doubts & scoring excellent marks in Class 12 exams.
Updated on:21/07/2023Topper's Solved these Questions
- XII BOARDSBOOK - XII BOARDS PREVIOUS YEARCHAPTER - XII BOARDSEXERCISE - SET- I
35 Videos
- XII BOARDSBOOK - XII BOARDS PREVIOUS YEARCHAPTER - XII BOARDSEXERCISE - SET- II
10 Videos
- XII BOARDSBOOK - XII BOARDS PREVIOUS YEARCHAPTER - XII BOARDSEXERCISE - QUESTION PAPER (SECTION-C)
22 Videos
- SAMPLE PAPER 2019BOOK - XII BOARDS PREVIOUS YEARCHAPTER - SAMPLE PAPER 2019EXERCISE - SECTION: D
1 Video
Similar Questions
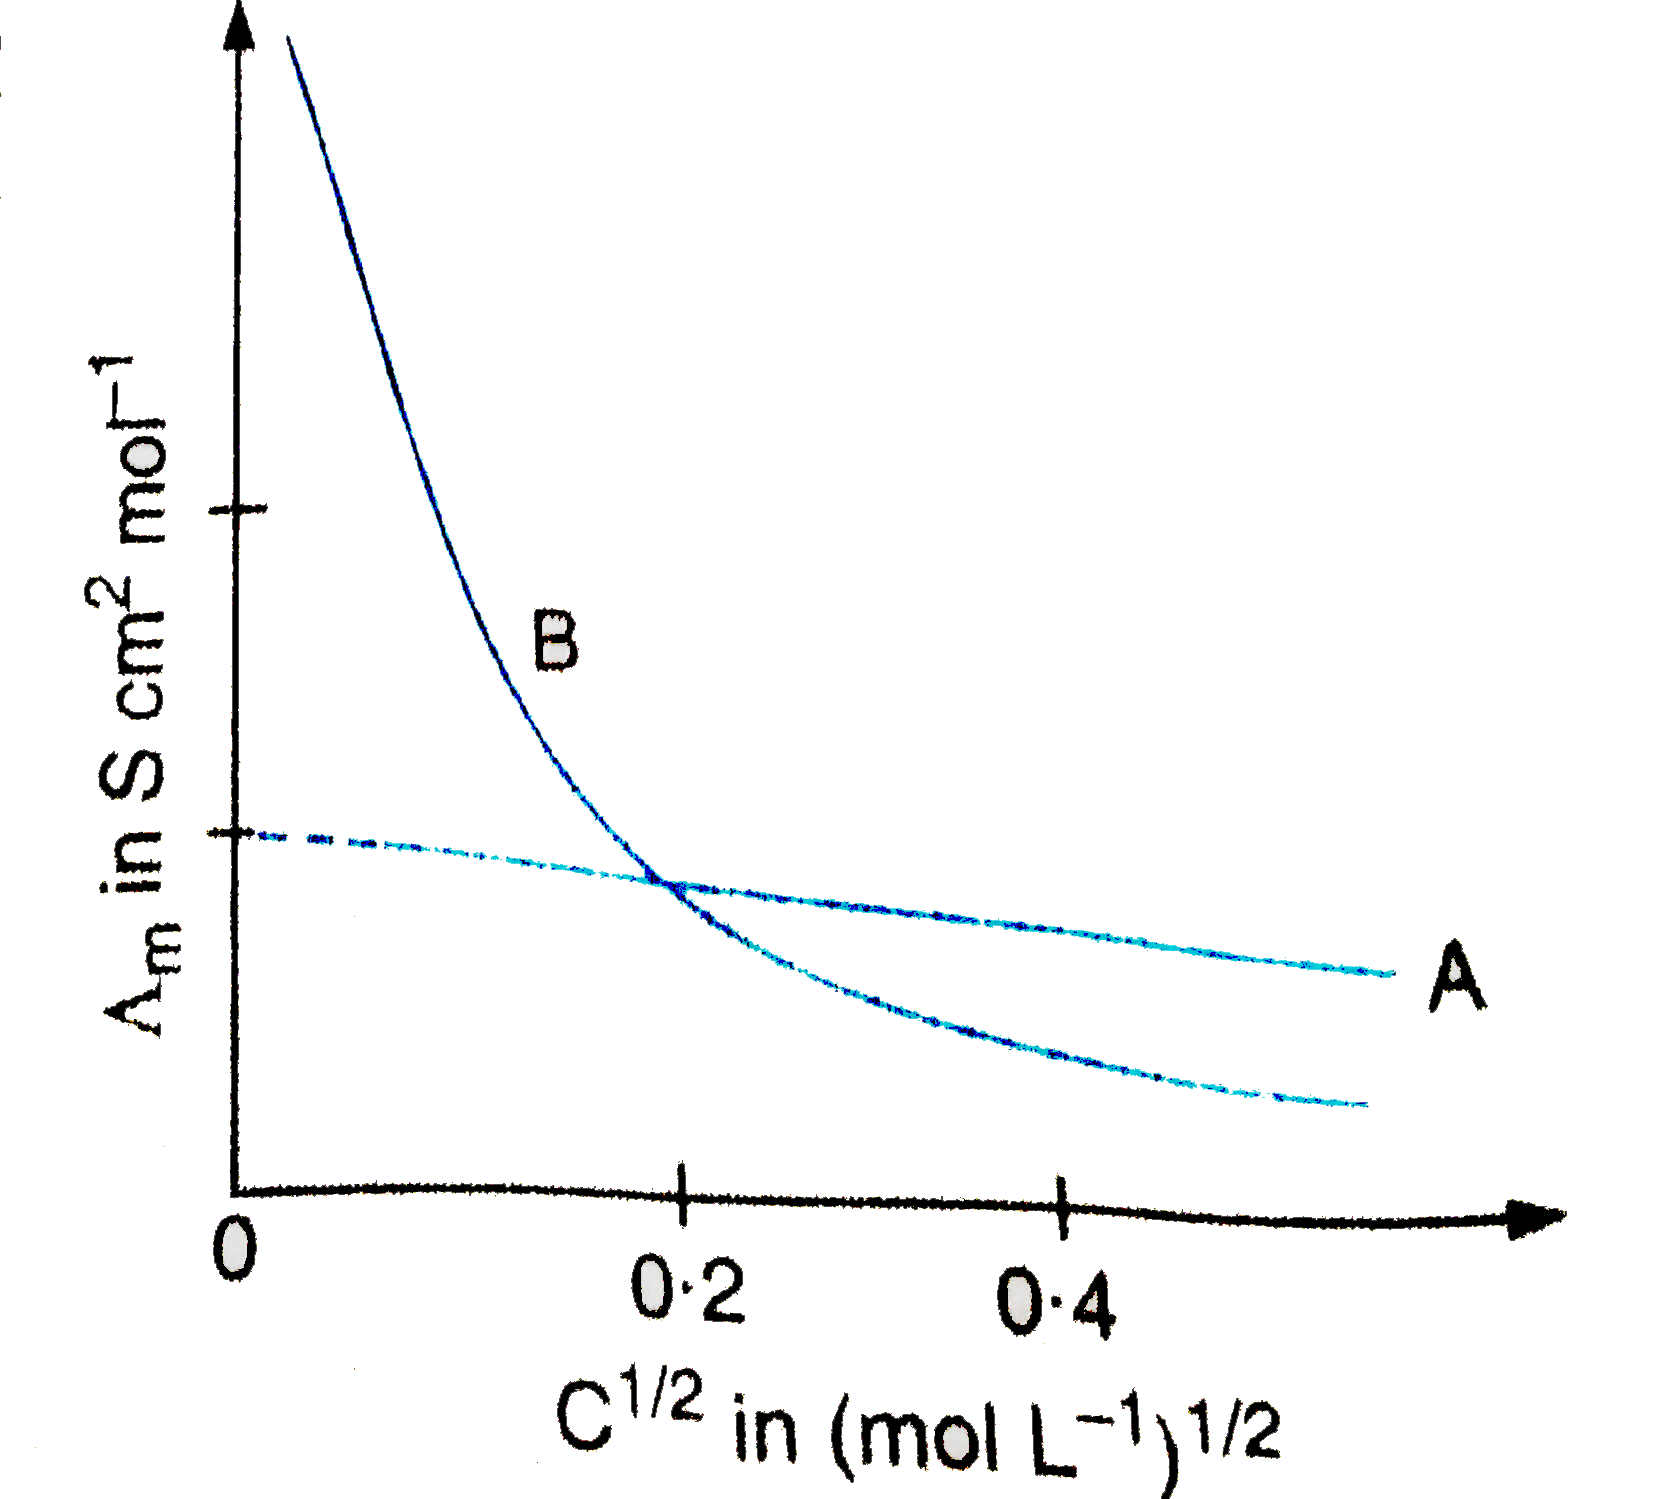
The following curve is obtained when molar conductivity Λm is plotted against the square root of concentration C1/2 (x-axis) for two electrolytes A and B :
(a) What can you say about the nature of the two electrolytes A and B ?
(b) How do you account for the increase in molar conductivity A, for the electrolytes A and B on dilution ?
View SolutionThe curves obtained when molar conductivity λm (along Y-axis) is plotted against the square root of concentration C1/2 (along X-axis) for two electrolytes 'A' and 'B' are shown.

(a) What can you say about the nature of the two electrolytes ?
(b) How do you account for the increase in molar conductivity Λm for the electrolytes A and B on dilution ?
View Solution
Knowledge Check
The unit of molar conductance of an electrolyte solution will be
Aohm−1 cm mol−1Bmho cm2 mol−1Cohm cm2 mol−1Dohm−1 cm−1 mol−1The molar conductivity of strong electrolyte
AIncreases on dilution slightlyBDoes not change on dilutionCDecreases on dilutionDDepends on density of electrolyte itself
How does the molar conductance of an electrolyte vary with dilution ?
View SolutionExplain with a graph the variation of molar conductivity of a strong electrolyte with dilution.
View SolutionResistivity is reciprocal of molar conductivity of electrolyte.
View SolutionDefine Molar conductivity ∧m, explain its variation with dilution.
View SolutionState the law that helps to determine limiting molar conductivity of a weak electrolyte.
View SolutionWhat is effect of increasing concentration on the molar conductivity of a weak electrolyte ?
View Solution
