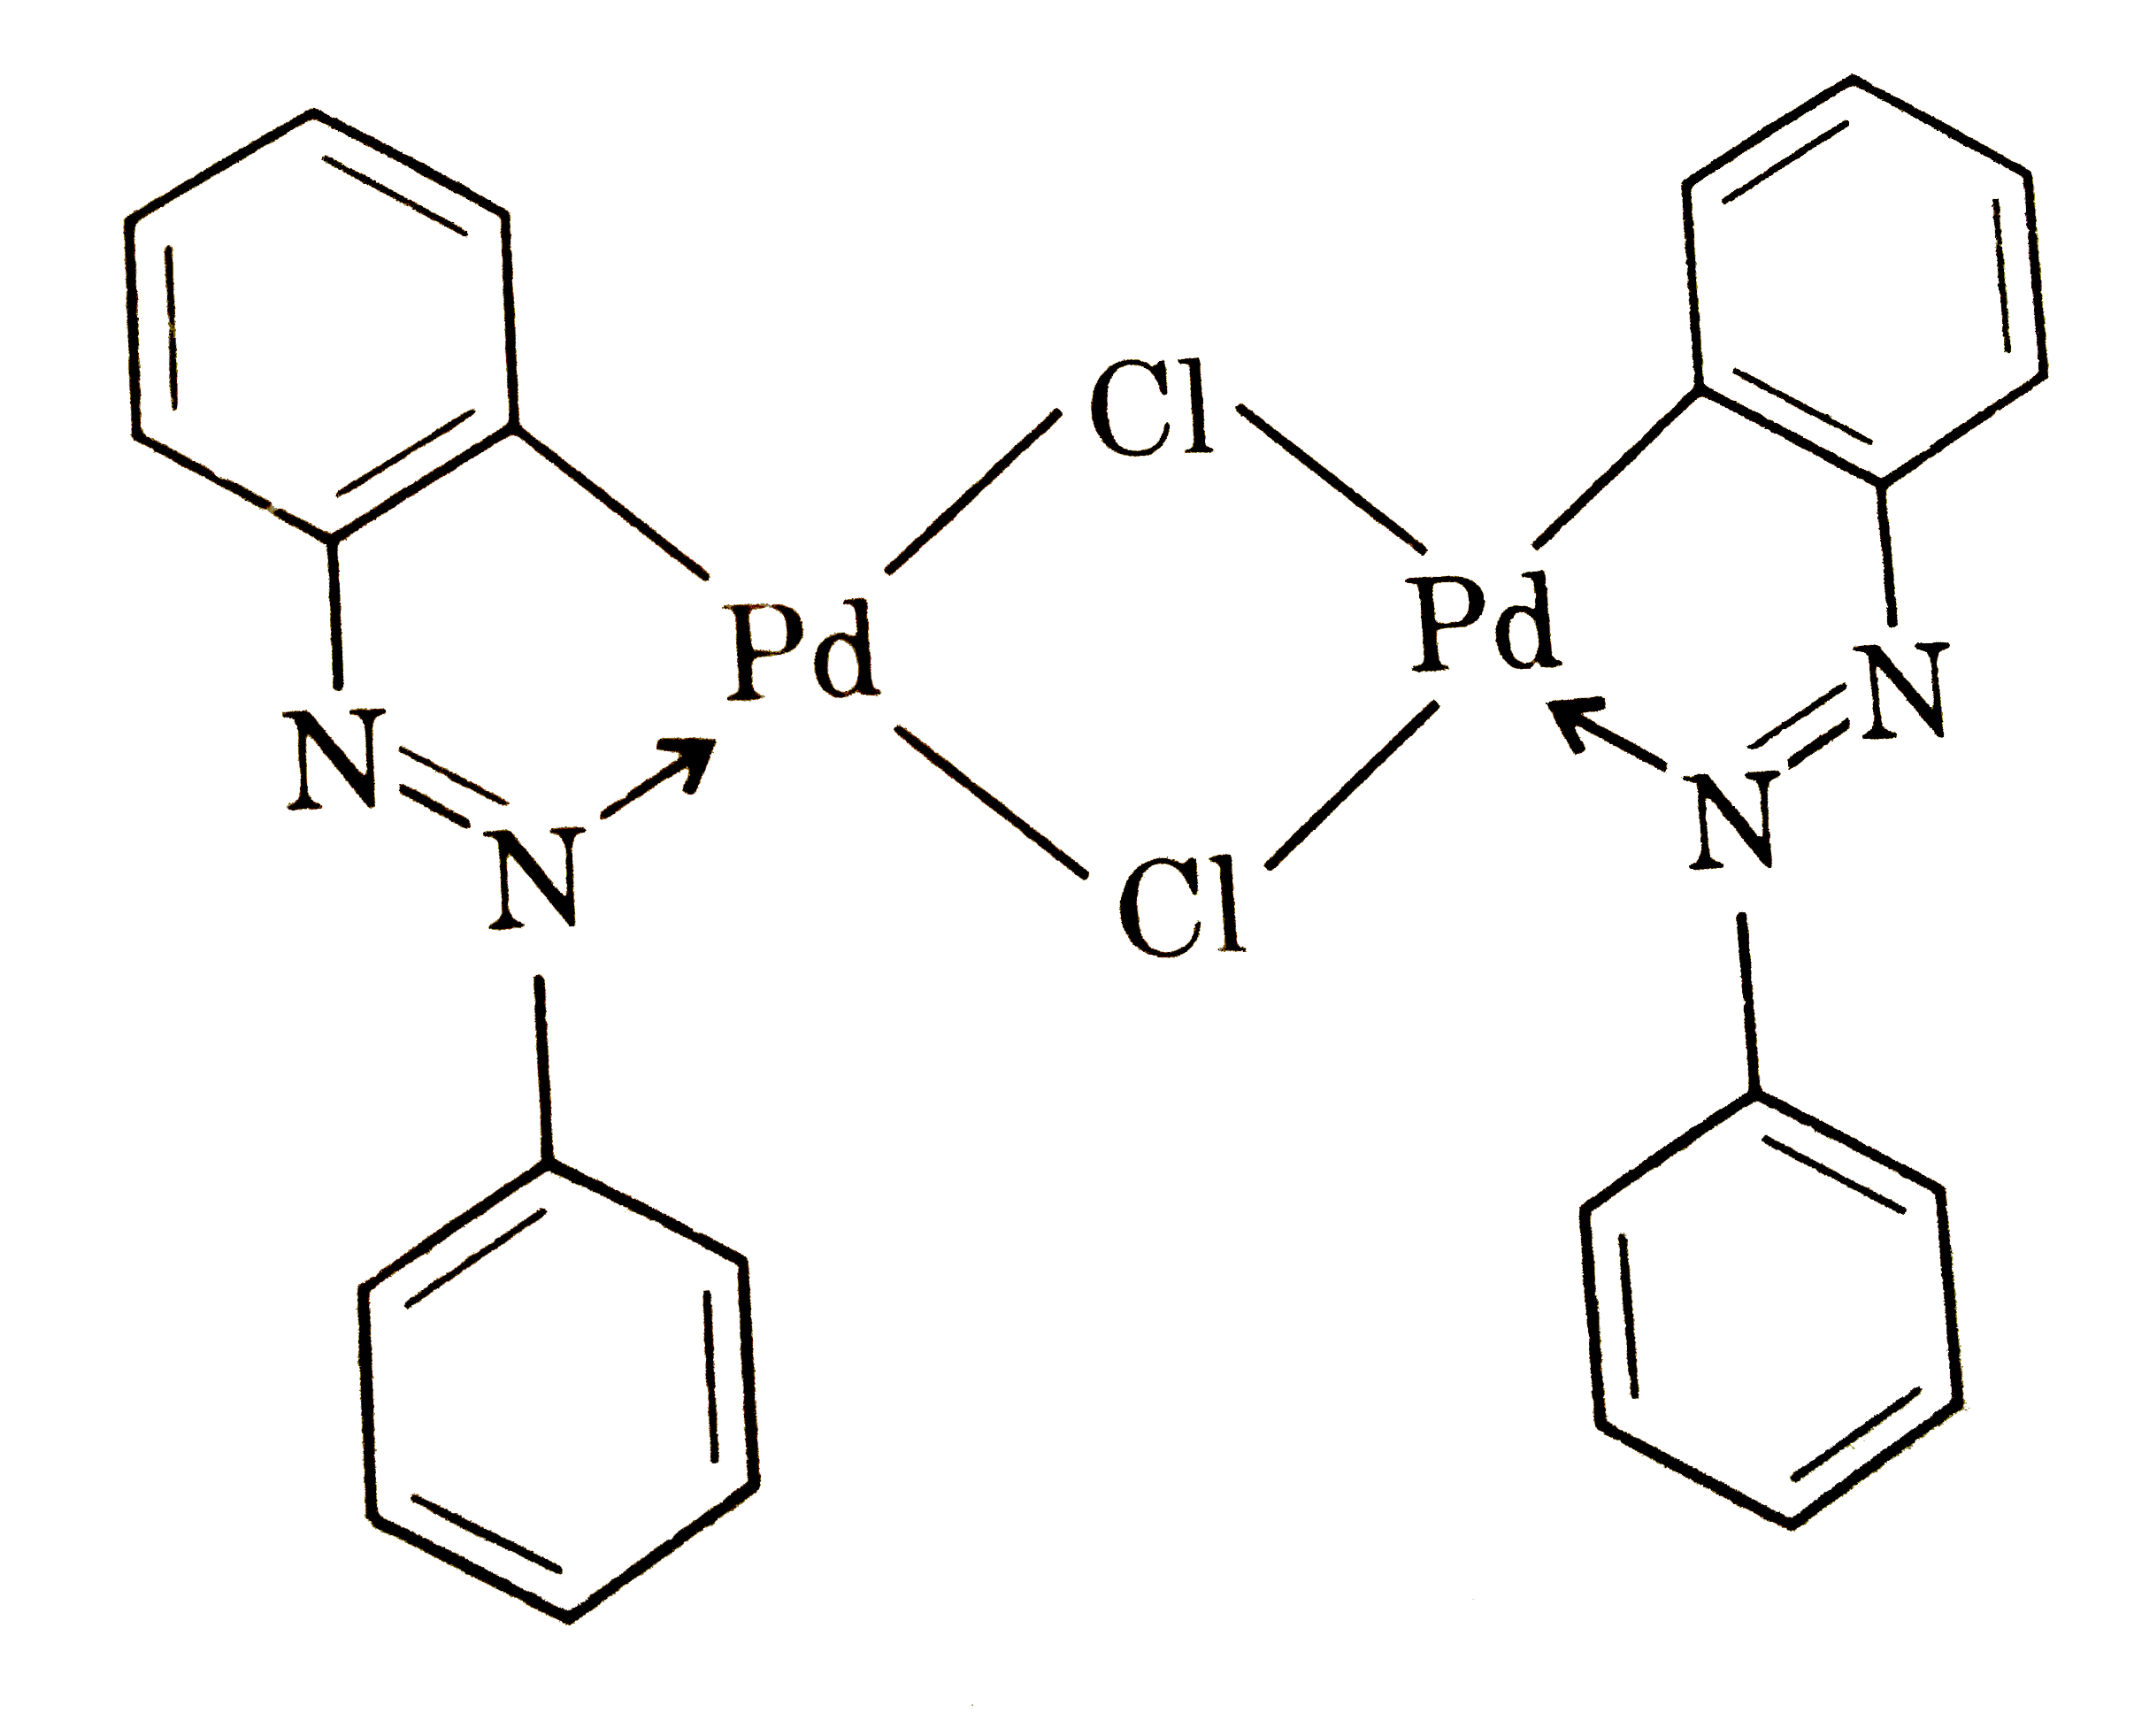
The complexes given below show:

optical isomerism
co-ordination isomerism
geometrical isomerism
bridged isomerism.
The correct Answer is:C
Geometrical isomerism arises in heteroleptic complexes due to different possible geometric arrangements of the ligands.
When two groups are on same side it is cis- and when those are on opposite side it is trans-
Topper's Solved these Questions
- BOOK - RESONANCECHAPTER - COORDINATION COMPOUNDSEXERCISE - Additional Problem for Self Practice (APSP) Part-IV Practice Test -2 (Section-2)5videos
COORDINATION COMPOUNDS
- BOOK - RESONANCECHAPTER - COORDINATION COMPOUNDSEXERCISE - Additional Problem for Self Practice (APSP) Part-IV Practice Test -2 (Section-3) (One Integer Value Correct Type )5videos
COORDINATION COMPOUNDS
- BOOK - RESONANCECHAPTER - COORDINATION COMPOUNDSEXERCISE - Additional Problem for Self Practice (APSP) Part-III Comprehension.3videos
COORDINATION COMPOUNDS
- BOOK - RESONANCECHAPTER - CHEMISTRY IN EVERYDAY LIFEEXERCISE - ORGANIC CHEMISTRY(Chemistry in every day life)31videos
CHEMISTRY IN EVERYDAY LIFE
- BOOK - RESONANCECHAPTER - D & F BLOCK ELEMENTSEXERCISE - INORGANIC CHEMISTRY(d & f- Block Elments)40videos
D & F BLOCK ELEMENTS
Similar Questions
Knowledge Check
- Question 1 - Select One
The complexes given below are –
 AGeometrical isomersBPosition isomersCOptical isomersDIdentical
 - Question 2 - Select One
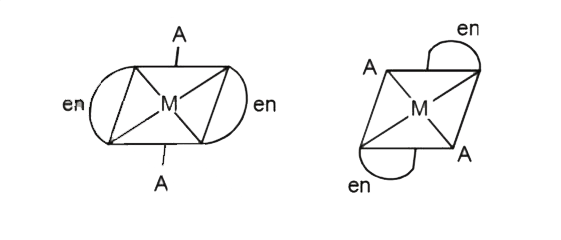
The two complexes given below are
 Ageometrical isomersBpsition isomersCoptical isomersDidentical
 - Question 3 - Select One
The two complexes given given below are
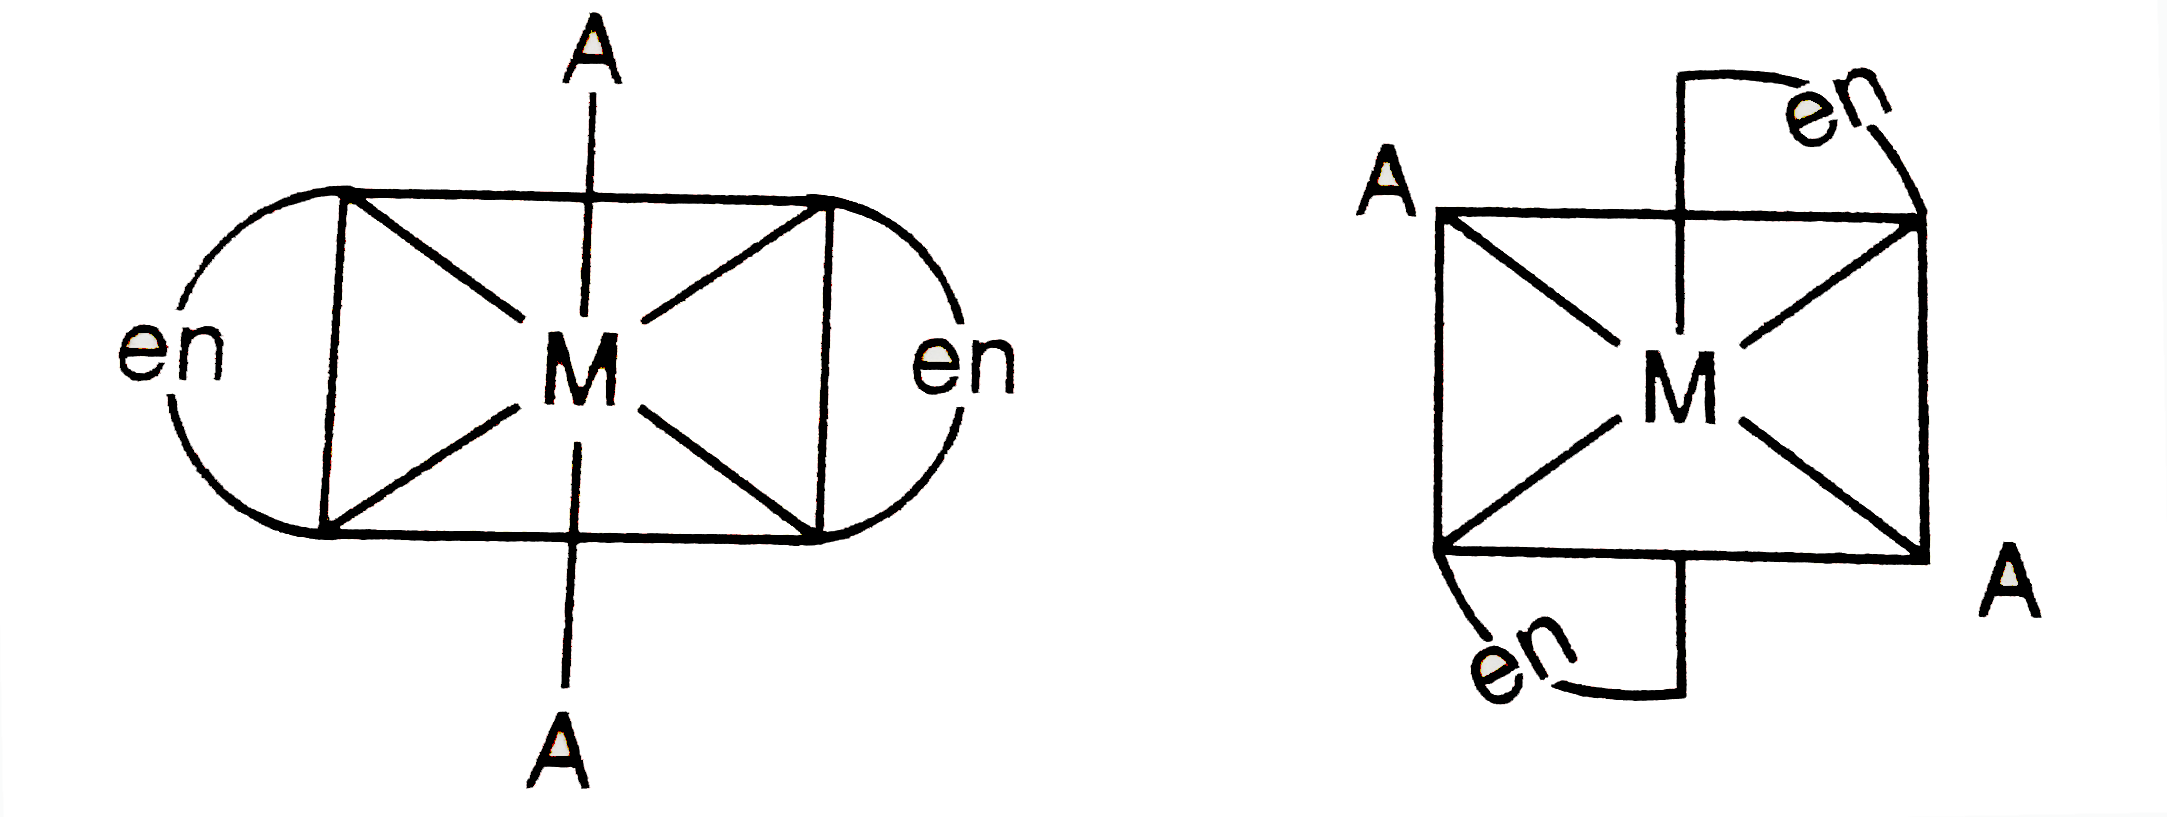 AGeometrical isomersBPosition isomersCOptical isomersDIdentical
The species given below that does NOT show disproportionation reaction is :
View SolutionThe table given below shows the number of customers (in thousand) visiting 2 shopping complexes A and B from january 2017 to June 2017.
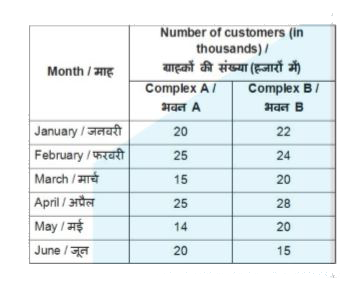
What was the percentage change in number of customers to complex B from March to April?View SolutionThe table given below shows the number of customers (in thousand) visiting 2 shopping complexes A and B from january 2017 to June 2017.
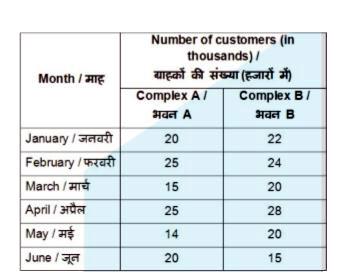
What is the total number of customers (in thousands) in the 2 complexes in the month of April?View SolutionThe table given below shows the number of customers (in thousand) visiting 2 shopping complexes A and B from january 2017 to June 2017.
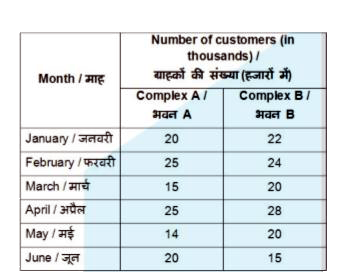
What is the average number of customers (in thousands) in complex B from February to May?View SolutionThe table given below shows the number of customers (in thousand) visiting 2 shopping complexes A and B from january 2017 to June 2017.
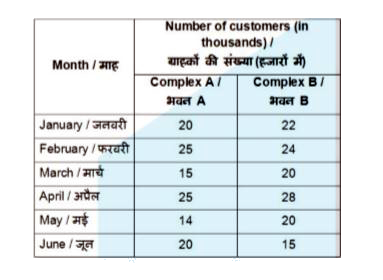
What is the maximum difference (in thousands) between the numbers of customers in the 2 complexes among the given months?View Solution


