15% population in developed countries consumes resources out of total
0.85
0.75
0.68
0.62
The correct Answer is:A
Step by step video, text & image solution for 15% population in developed countries consumes resources out of total by Biology experts to help you in doubts & scoring excellent marks in Class 12 exams.
Updated on:21/07/2023Topper's Solved these Questions
- ENVIRONMENTAL ISSUESBOOK - DINESH PUBLICATIONCHAPTER - ENVIRONMENTAL ISSUESEXERCISE - Model test paper-4
100 Videos
- ECHINODERMATABOOK - DINESH PUBLICATIONCHAPTER - ECHINODERMATAEXERCISE - REVISION QUESTIONS
65 Videos
- EVIDENCES OF EVOLUTIONBOOK - DINESH PUBLICATIONCHAPTER - EVIDENCES OF EVOLUTIONEXERCISE - CHECK YOUR GRASP
3 Videos
Similar Questions
If exports of developing countries accounted for 36% of the total worldwide exports,then what is the value of the exports of Japan as a percentage of the exports of the developing coun- tries?
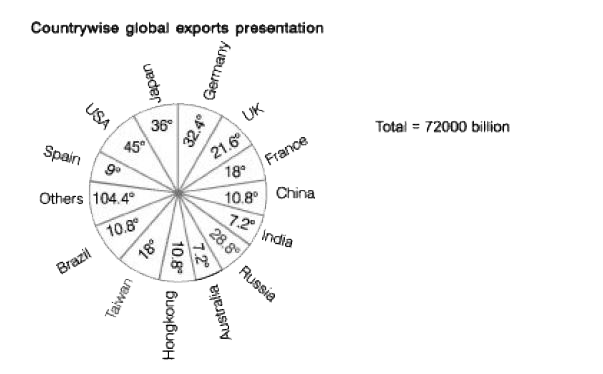
View SolutionDirections: The given pie-charts compares the total population and the female population of six countries, Australia, Canada, Germany, India, USA and Philippines. The first pie chart gives the percentage distribution of the total population of the six countries, while, the second pie chart gives the percentage distribution of the female population of the six countries. Study the pie-charts and answer the questions that follow.
If the total number of females in India and USA is equal to the total population of the Philippines, then what is the ratio of the number of males in Australia to the number of females in Canada?
View Solution
Knowledge Check
In a given question below is a statement followed by two conclusions numbered I and II. You have to assume everything in the statement to be true, then consider the two conclusions together and decide which of them logically follows beyond a reasonable doubt from the information given in the statement.
Give answer
(a) if only conclusion I follows, (b) if only conclusion II follows,
(c) if either I or II follows,
(d) if neither I nor II follows: and
(e) if both I and II follow
Statement: Population increase coupled with depleting resources is going to be the scenario of many developing countries in days to come.
conclusion:
I. The population of developing countries will not continue to increase in future.
II. It will be very difficult for the governments of developing countries to provide its people decent quality of life.Aif only conclusion I followsBif only conclusion II followsCif either I or II followsDif neither I nor II followsAssertion (A): The growth rate of population in developing countries is higher than that of developed countries.
Reason (R): Low level of economic development leads to high total fertility rate.ABoth A and R are ture and R is the correct explanation of A.BBoth A and R are true, but R is not the correct explanation of A.CA is true, but R is false.DA is false, but R is true.The table given below shows the per capita income ( in Rs ) and total population for 6 different countries .
Per capita Income
= Total income of country / Population of country
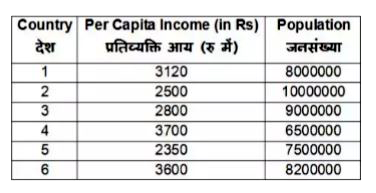
What is the total income (in Rs '000) of country 3?A25200B28700C26400D21300
Directions: The given pie-charts compares the total population and the female population of six countries, Australia, Canada, Germany, India, USA and Philippines. The first pie chart gives the percentage distribution of the total population of the six countries, while, the second pie chart gives the percentage distribution of the female population of the six countries. Study the pie-charts and answer the questions that follow.
If the average population of Australia, Canada and Germany is 155400 more than the total population of India, then the total population of USA and Philippines is how much less than the total population of India?
View SolutionDirections: The given pie-charts compares the total population and the female population of six countries, Australia, Canada, Germany, India, USA and Philippines. The first pie chart gives the percentage distribution of the total population of the six countries, while, the second pie chart gives the percentage distribution of the female population of the six countries. Study the pie-charts and answer the questions that follow.
If the number of females in Germany is 116550 less than the total population of USA and Philippines, and the total population of Germany is 25900 less than 2 times the female population of Australia, then what is the female population of Germany?
View SolutionThe table below shows the distribution of number of people living in 8 different countries and the per capita income of each of the countries. The total population of these countries taken together is 200 crores. Per capita income= total GDP of country/population of the country.
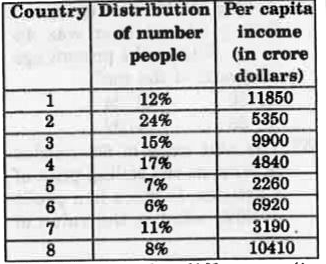
What is the total GDP (in crore dollars) of country 5?
View SolutionThe table below shows the distribution of number of people living in 8 different countries and the per capita income of each of the countries. The total population of these countries taken together is 200 crores. Per capita income= total GDP of country/population of the country.
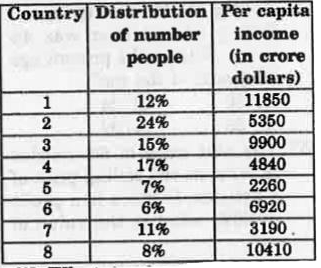
Which country has the highest total GDP?
View SolutionThe table below shows the distribution of number of people living in 8 different countries and the per capita income of each of the countries. The total population of these countries taken together is 200 crores. Per capita income= total GDP of country/population of the country.
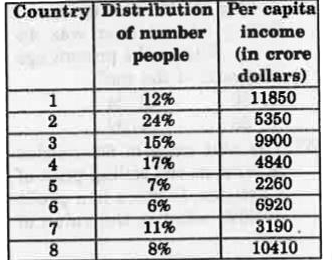
What is the total GDP (in crore dollars) for the country with the third lowest per capita income?
View Solution
