Figure shows a circular area of radius R where uniform magnetic →B is going into the plane of paper and increasing in magnitude at a constant rate. In that case, which of the following graphs, drawn schematically, correctly shows the variation of the induced electric field E(r)?


The correct Answer is:A
Magnetic field is increasing with constant rate

B=−B0tˆk
Nagnetic flux passing through at r<R
ϕ=Bπr2
ϕ=B0tπr2
emf induced
V=dϕdt=B0πr2
As we know at any instant, r<R
E×dl=dv
V=E(2πr)=B0πr2
E=B0r2
E∝r
For outside the loop
ϕ=BπR2
ϕ=B0tπR2
V=dϕdt=B0πR2
E×(2πr)=B0πR2⇒E=B0R22r⇒E∝1r

Topper's Solved these Questions
- ELECTROMAGNETIC INDUCTIONBOOK - MODERN PUBLICATIONCHAPTER - ELECTROMAGNETIC INDUCTIONEXERCISE - COMPETITION FILE (MULTIPLE CHOICE QUESTIONS BASED ON GIVEN PASSAGE)
7 Videos
- ELECTROMAGNETIC INDUCTIONBOOK - MODERN PUBLICATIONCHAPTER - ELECTROMAGNETIC INDUCTIONEXERCISE - COMPETITION FILE (ASSERTION REASON TYPE QUESTIONS)
10 Videos
- ELECTROMAGNETIC INDUCTIONBOOK - MODERN PUBLICATIONCHAPTER - ELECTROMAGNETIC INDUCTIONEXERCISE - COMPETITION FILE (MULTIPLE CHOICE QUESTIONS) (AIPMT/NEET & Other State Boards for Medical Entrance)
8 Videos
- ELECTRIC CHARGES AND FIELDS BOOK - MODERN PUBLICATIONCHAPTER - ELECTRIC CHARGES AND FIELDS EXERCISE - Chapter Practice Test
15 Videos
- ELECTROMAGNETIC WAVESBOOK - MODERN PUBLICATIONCHAPTER - ELECTROMAGNETIC WAVESEXERCISE - CHAPTER PRACTICE TEST
14 Videos
Similar Questions
Figure shows a circular region of radius R in which uniform magnetic field B exists. The magnetic field is increasing at a rate dBdt. The induced electric field at a distance r from the centre for r<R is

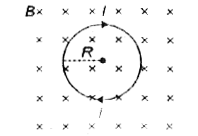
View SolutionA circular loop of radius R is kept in a uniform magnetic field pointing perpendicular into the plane of paper. When a current l flows in the loop, the tension produced in the loop is
View Solution
Knowledge Check
A circular loop of radius R is kept in a uniform magnetic field pointing perpendicular into the plane of paper. When a current l flows in the loop, the tension produced in the loop is
 ABiRBBIR2C2BIRDZero
A rectangular loop of wire in the plane of the paper starts outside a perpendicular uniform magnetic field directed into the paper as shown in the following figure. The loop is pulled with a constant velocity through the magnetic field and out the other side. Which of the following graphs would best represent the variation of the electric current in the wire with time?
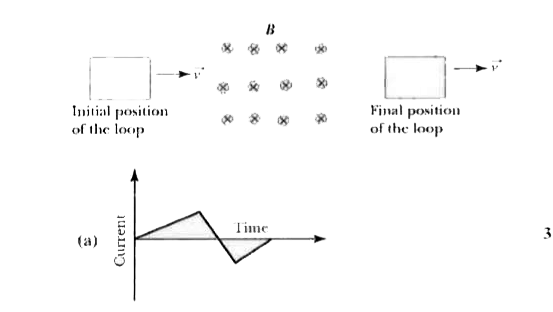 A
A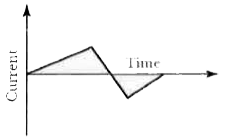 B
B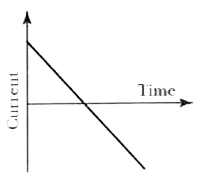 C
C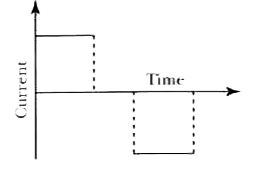 D
D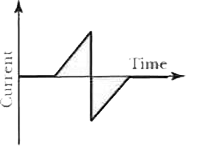
Which of the following graphs shows the variation of magnetic induction B with distance r from a long wire carrying current
A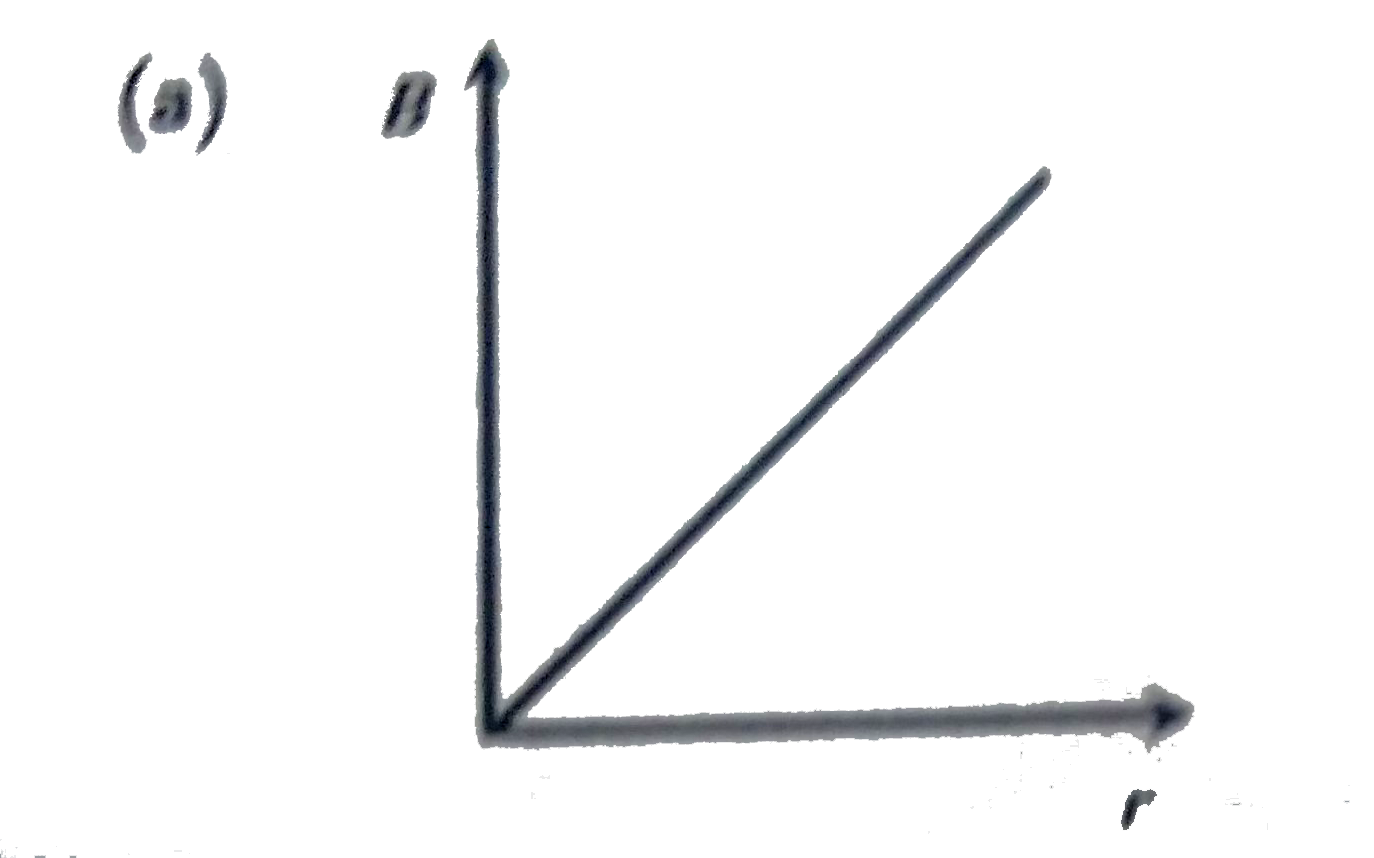 B
B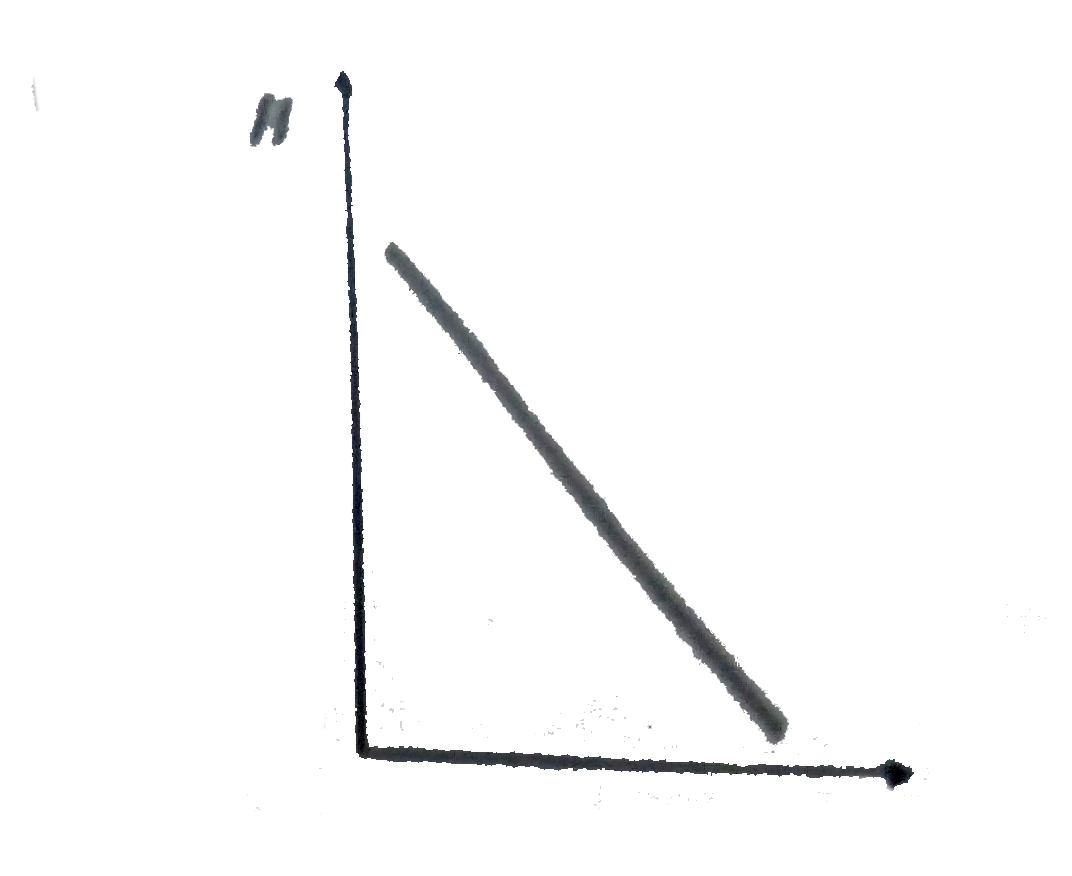 C
C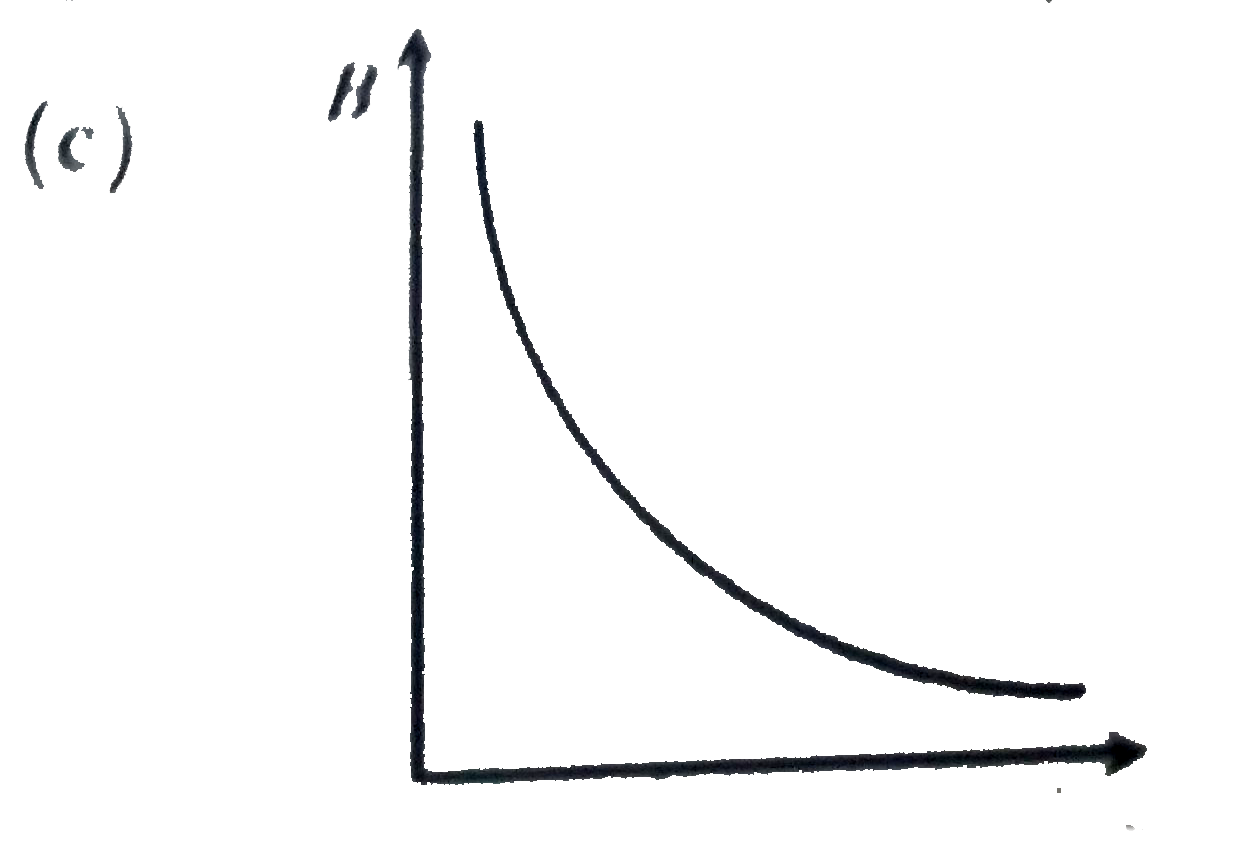 D
D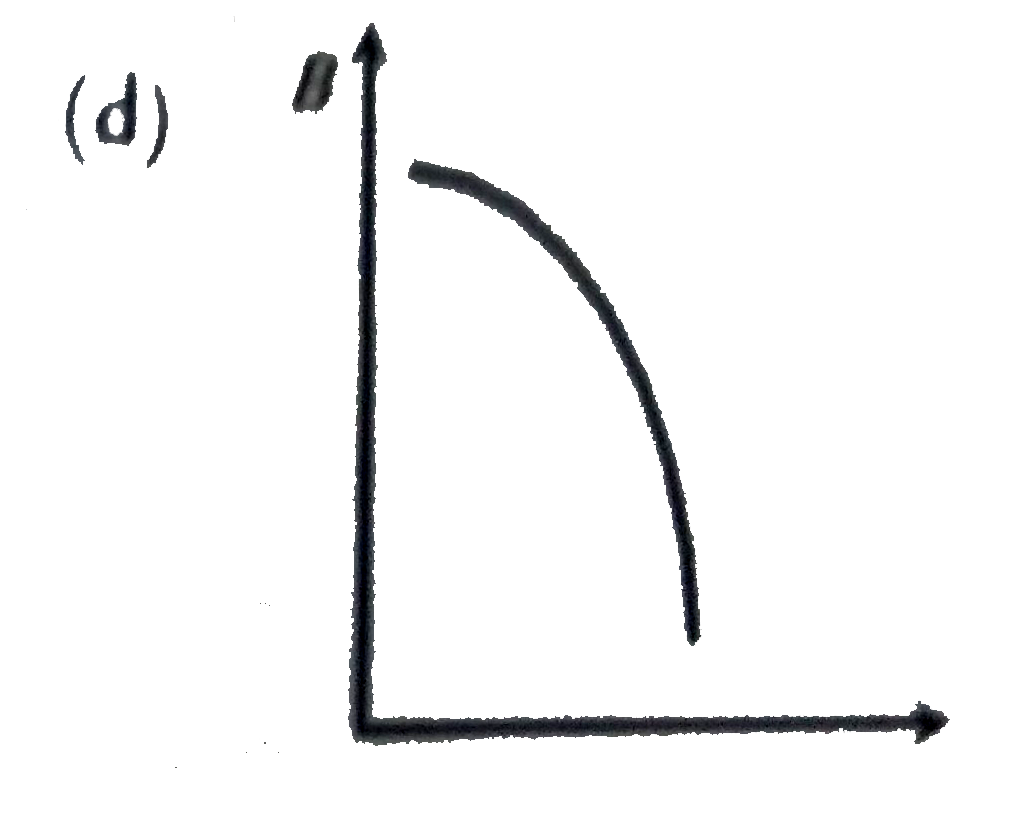
A circular wire loop of radius r is placed in a region of uniform magnetic field B such that the plane of the loop makes an angle θ with the direction of B. In which of the following conditions, will no emf be induced in the loop?
View SolutionA uniform rod of length l is rotating with constant angular speed ω as shown in figure. Choose the graph which correctly shows the variation of T with x.
_2019_CBT7_E01_017_Q01.png)
View SolutionA circular wire loop of radius r is placed in a region of uniform magnetic field B such that the plane of the loop makes an angle θ with the direction of B. In which of the following conditions, will no emf be induced in the loop?
View SolutionA uniform but time varying magnetic field is present in a circular region of radius R. The magnetic field is perpendicular and into the plane of the loop and the magnitude of field is increasing at a constant rate α. There is a straight conducting rod of length 2R placed as shown in figure.
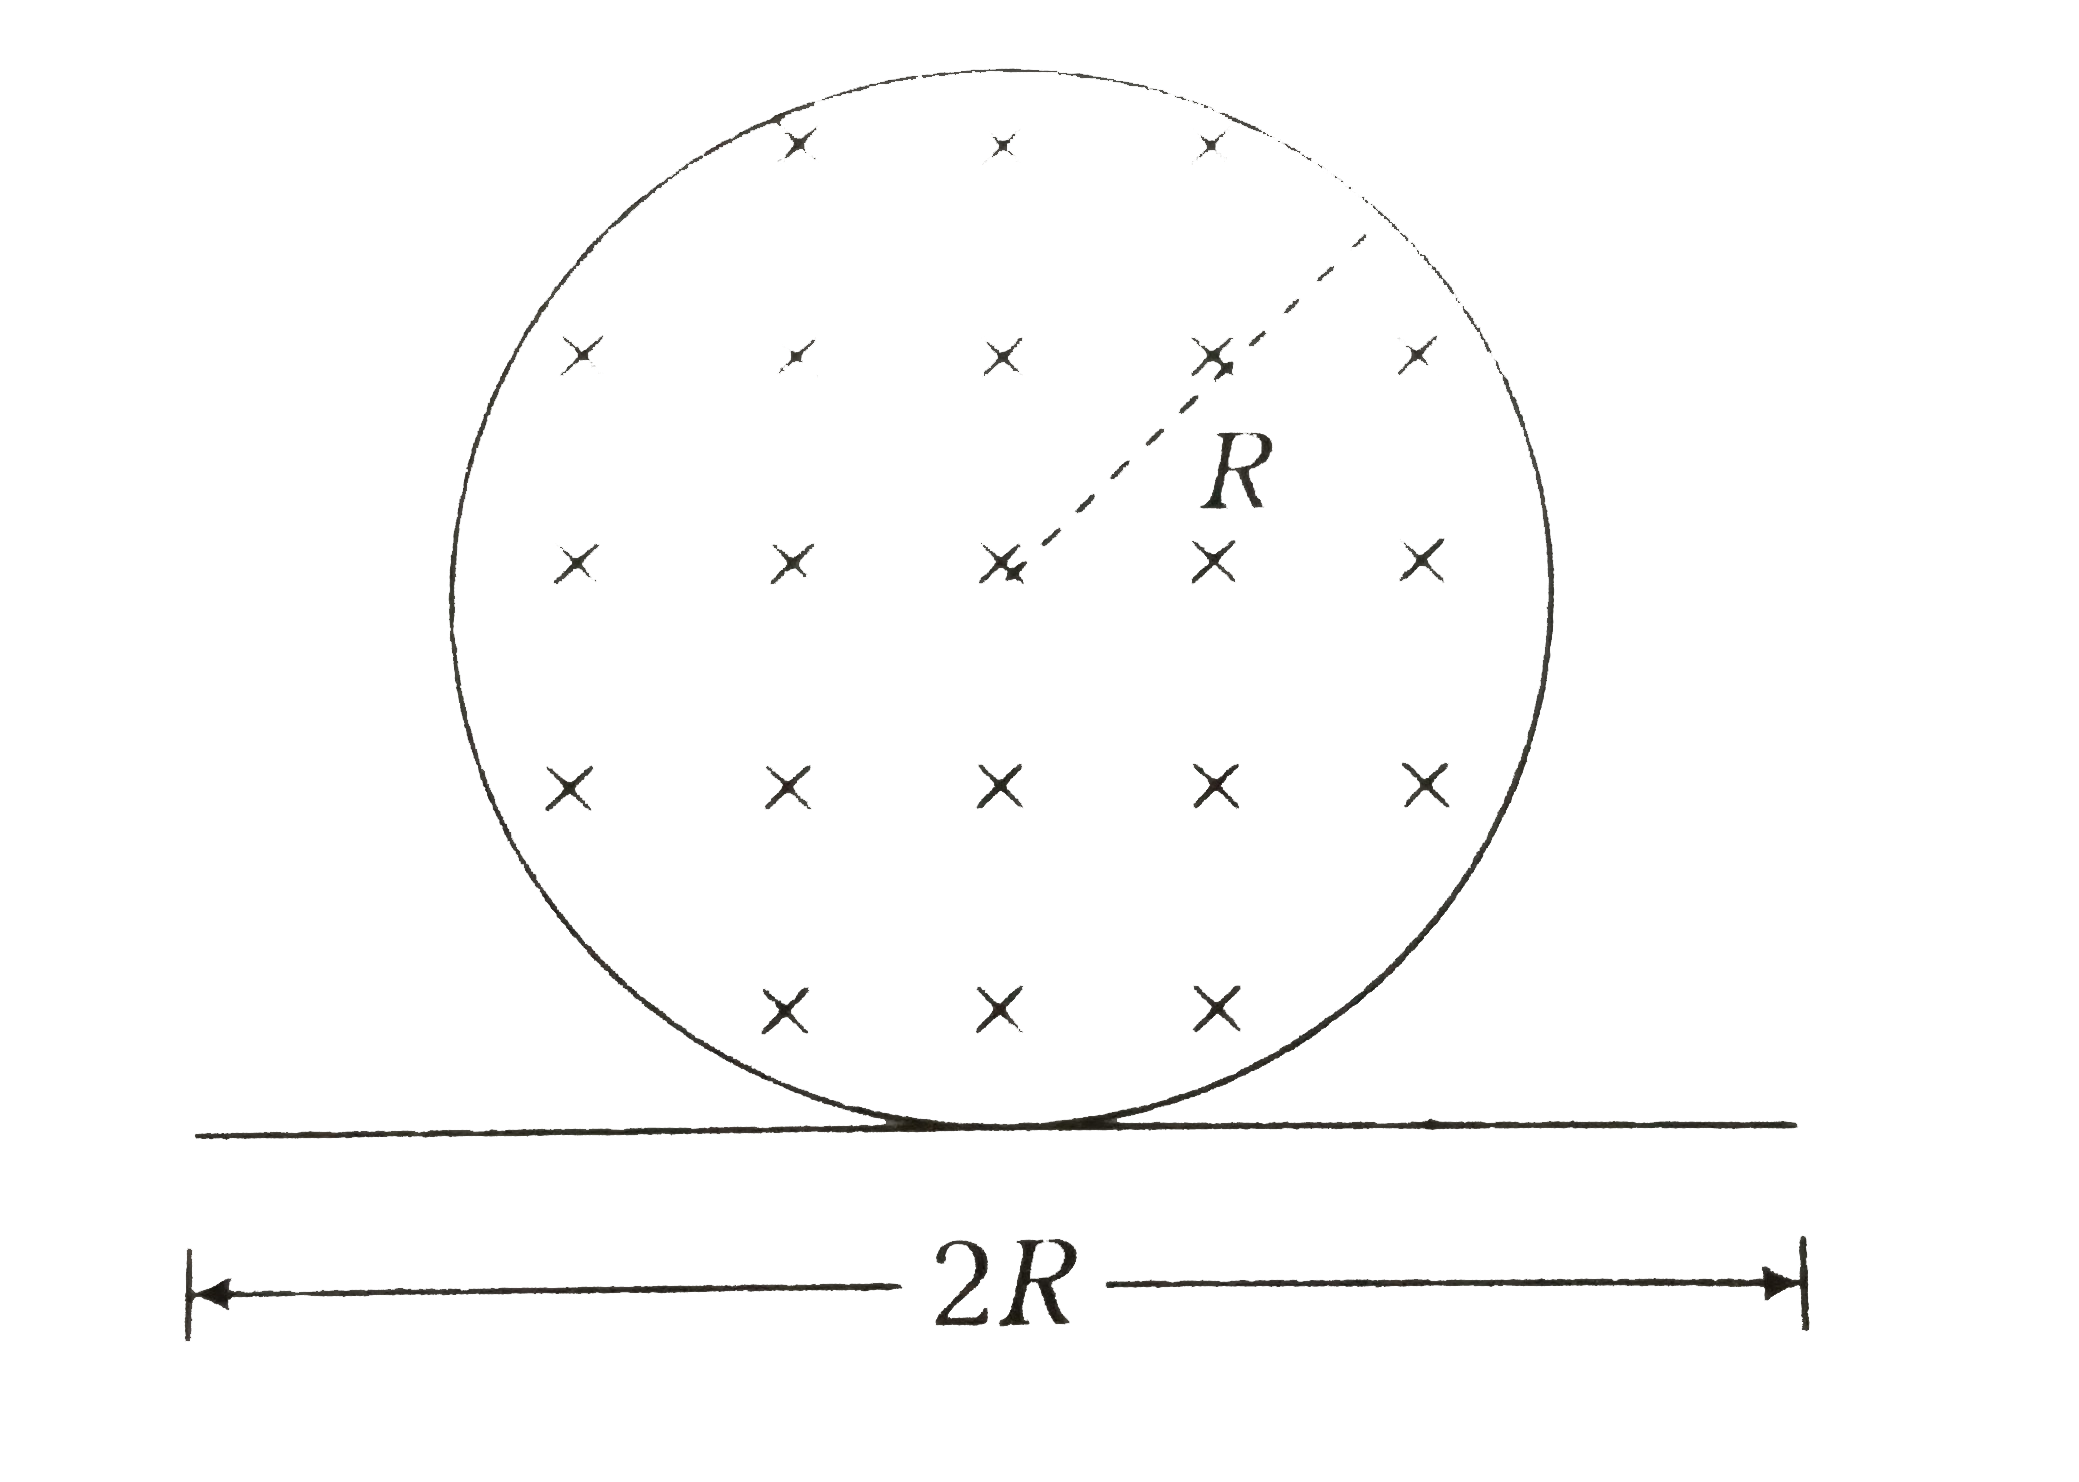
The magnitude of induced emf across the rod is
View SolutionA uniform rod of length l is rotating with constant angular speed ω as shown in figure. Choose the graph which correctly shows the variation of T with x.
_2019_CBT7_E01_017_Q01.png)
View Solution
