Plot a graph showing variation of a de Broglie wavelength (λ) associated with a charged particle of mass m, verses 1/√V, where V is the potential difference thrugh which the particle is accelerated. How does this graph give us the information the magnitude the magnitude of the charge of the particle ?
Step by step video & image solution for Plot a graph showing variation of a de Broglie wavelength (lamda) associated with a charged particle of mass m, verses 1//sqrtV, where V is the potential difference thrugh which the particle is accelerated. How does this graph give us the information the magnitude the magnitude of the charge of the particle ? by Physics experts to help you in doubts & scoring excellent marks in Class 12 exams.
Updated on:21/07/2023Topper's Solved these Questions
- DUAL NATURE OF RADIATION AND MATTER BOOK - MODERN PUBLICATIONCHAPTER - DUAL NATURE OF RADIATION AND MATTER EXERCISE - Revision Exercises (Additional Questions)
8 Videos
- DUAL NATURE OF RADIATION AND MATTER BOOK - MODERN PUBLICATIONCHAPTER - DUAL NATURE OF RADIATION AND MATTER EXERCISE - Revision Exercises (Fill in the Blanks)
11 Videos
- DUAL NATURE OF RADIATION AND MATTER BOOK - MODERN PUBLICATIONCHAPTER - DUAL NATURE OF RADIATION AND MATTER EXERCISE - Higher Order Thinking Skills & Advanced Level (QUESTIONS WITH ANSWERS)
8 Videos
- CURRENT ELECTRICITYBOOK - MODERN PUBLICATIONCHAPTER - CURRENT ELECTRICITYEXERCISE - Chapter Practice Test
15 Videos
- ELECTRIC CHARGES AND FIELDS BOOK - MODERN PUBLICATIONCHAPTER - ELECTRIC CHARGES AND FIELDS EXERCISE - Chapter Practice Test
15 Videos
Similar Questions
Write the relationship of de-Broglie wavelength λ associated with a particle of mass m in terms of its kinetic energy.
View SolutionWrite the expression for the de-Broglie wavelength associated with a charge particle having charge 'q' and mass 'm', when it is accelerated by a potential V.
View Solution
Knowledge Check
The de-Broglie wavelength λ associated with charged particle of charge q, mass m and potential difference V is
Ah√2mqVBh2√2mqVCh√mqVDh√2qVThe de - Broglie wavelength associated with the particle of mass m moving with velocity v is
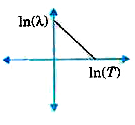
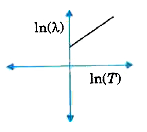
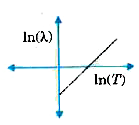
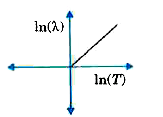
Ah/mvBmv/hCh/2vDm/hvThe graph showing the relation between de Broglie wavelength λ of particle and its temperature T is
A B
B C
C D
D
Write the expression for the de-Broglie wavelength associated with a charged particle having charge 'q' and mass 'm' when it is accelerated by a potential V.
View SolutionThe wavelength of a charged particle ………….. the square root of the potential difference through which it is accelerated .
View SolutionThe ratio of de-Broglie wavelength associated with a proton and a μ-particle accelerated through the same potential difference 'V' is
View SolutionThe de-Broglie wavelength associated with a particle of mass 10−6kg moving with a velocity of 10ms−1, is
View SolutionA particle of mass m and charge q travels from rest through a potential difference V. Its final energy is
View Solution
