(a) Name different series of lines observed in hydrogen spectrum.
(b) Draw energy level diagram of hydrogen atom.
Step-by-Step Solution
1. Lyman Series (L):
- Initial state: n = 1
- Final states: n = 2, 3, 4, ... (to infinity)
- Transitions: 2 to 1, 3 to 1, 4 to 1, etc.
2. Balmer Series (B):
- Initial state: n = 2
- Final states: n = 3, 4, 5, ... (to infinity)
- Transitions: 3 to 2, 4 to 2, 5 to 2, etc.
3. Paschen Series (P):
- Initial state: n = 3
- Final states: n = 4, 5, 6, ... (to infinity)
- Transitions: 4 to 3, 5 to 3, etc.
4. Bracket Series (Br):
- Initial state: n = 4
- Final states: n = 5, 6, 7, ... (to infinity)
- Transitions: 5 to 4, 6 to 4, etc.
5. Fund Series (F):
- Initial state: n = 5
- Final states: n = 6, 7, 8, ... (to infinity)
- Transitions: 6 to 5, 7 to 5, etc.
6. Humphrey Series (H):
- Initial state: n = 6
- Final states: n = 7, 8, 9, ... (to infinity)
- Transitions: 7 to 6, 8 to 6, etc.
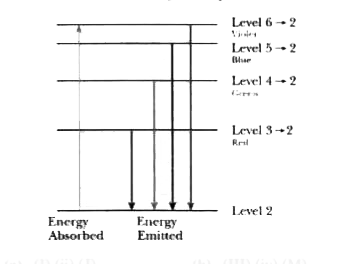
(b) Energy Level Diagram of Hydrogen Atom:
1. Draw Horizontal Lines for Energy Levels:
- Start by drawing horizontal lines representing energy levels. Label them as n=1, n=2, n=3, n=4, n=5, n=6, and n=7 from bottom to top.
2. Indicate Transitions for Each Series:
- For the Lyman series, draw downward arrows from n=2, n=3, n=4, etc., to n=1.
- For the Balmer series, draw downward arrows from n=3, n=4, n=5, etc., to n=2.
- For the Paschen series, draw downward arrows from n=4, n=5, etc., to n=3.
- For the Bracket series, draw downward arrows from n=5, n=6, etc., to n=4.
- For the Fund series, draw downward arrows from n=6, n=7, etc., to n=5.
- For the Humphrey series, draw downward arrows from n=7, n=8, etc., to n=6.
3. Label the Arrows:
- Label each arrow with the corresponding series name (Lyman, Balmer, Paschen, Bracket, Fund, Humphrey).
- Initial state: n = 1
- Final states: n = 2, 3, 4, ... (to infinity)
- Transitions: 2 to 1, 3 to 1, 4 to 1, etc.
- Initial state: n = 2
- Final states: n = 3, 4, 5, ... (to infinity)
- Transitions: 3 to 2, 4 to 2, 5 to 2, etc.
- Initial state: n = 3
- Final states: n = 4, 5, 6, ... (to infinity)
- Transitions: 4 to 3, 5 to 3, etc.
- Initial state: n = 4
- Final states: n = 5, 6, 7, ... (to infinity)
- Transitions: 5 to 4, 6 to 4, etc.
- Initial state: n = 5
- Final states: n = 6, 7, 8, ... (to infinity)
- Transitions: 6 to 5, 7 to 5, etc.
- Initial state: n = 6
- Final states: n = 7, 8, 9, ... (to infinity)
- Transitions: 7 to 6, 8 to 6, etc.
- Start by drawing horizontal lines representing energy levels. Label them as n=1, n=2, n=3, n=4, n=5, n=6, and n=7 from bottom to top.
- For the Lyman series, draw downward arrows from n=2, n=3, n=4, etc., to n=1.
- For the Balmer series, draw downward arrows from n=3, n=4, n=5, etc., to n=2.
- For the Paschen series, draw downward arrows from n=4, n=5, etc., to n=3.
- For the Bracket series, draw downward arrows from n=5, n=6, etc., to n=4.
- For the Fund series, draw downward arrows from n=6, n=7, etc., to n=5.
- For the Humphrey series, draw downward arrows from n=7, n=8, etc., to n=6.
- Label each arrow with the corresponding series name (Lyman, Balmer, Paschen, Bracket, Fund, Humphrey).
Topper's Solved these Questions
- ATOMS BOOK - MODERN PUBLICATIONCHAPTER - ATOMS EXERCISE - COMPETITION FILE (Objective A(MCQs) )
16 Videos
- ATOMS BOOK - MODERN PUBLICATIONCHAPTER - ATOMS EXERCISE - COMPETITION FILE ( Objective B (MCQs))
20 Videos
- ATOMS BOOK - MODERN PUBLICATIONCHAPTER - ATOMS EXERCISE - Revision Exercise (Long Answer )
5 Videos
- ALTERNATING CURRENT BOOK - MODERN PUBLICATIONCHAPTER - ALTERNATING CURRENT EXERCISE - CHAPTER PRACTICE TEST
16 Videos
- CURRENT ELECTRICITYBOOK - MODERN PUBLICATIONCHAPTER - CURRENT ELECTRICITYEXERCISE - Chapter Practice Test
15 Videos
Similar Questions
Knowledge Check
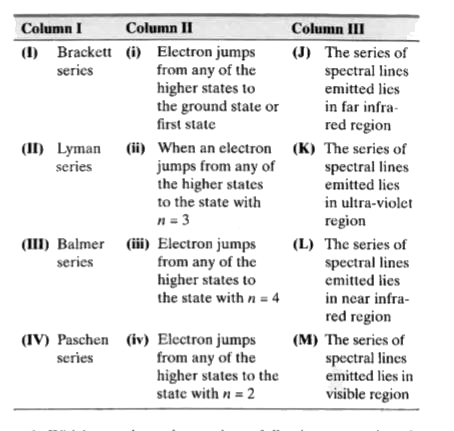
In a hydrogen atom, whenever there is transition of electron between different energy levels, energy is emitted or absorbed, and hydrogen spectrum is obtained. In the given table, Column I shows the names of the different series of hydrogen atom spectrum, Column II shows the energy levels from where electron transition takes place and Column III shows the EM wave region where these different series exists.

Which series does the diagram depict?
 A(I)(ii)(J)B(III)(iv)(M)C(II)(iii)(L)D(I)(i)(M)
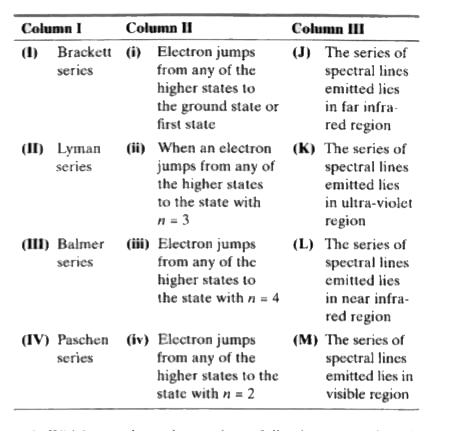
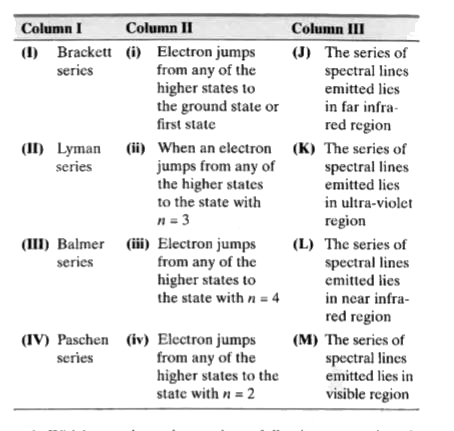
In a hydrogen atom, whenever there is transition of electron between different energy levels, energy is emitted or absorbed, and hydrogen spectrum is obtained. In the given table, Column I shows the names of the different series of hydrogen atom spectrum, Column II shows the energy levels from where electron transition takes place and Column III shows the EM wave region where these different series exists.

Which series has the following wavelength v=RZ2(142−1n22)?A(II)(ii)(J)B(I)(iii)(J)C(IV)(i)(L)D(II)(iii)(M)In a hydrogen atom, whenever there is transition of electron between different energy levels, energy is emitted or absorbed, and hydrogen spectrum is obtained. In the given table, Column I shows the names of the different series of hydrogen atom spectrum, Column II shows the energy levels from where electron transition takes place and Column III shows the EM wave region where these different series exists.

Which series has the following wavelength v=RZ2(112−1n22),n2=2,3,4,5,....?A(I)(iv)(M)B(IV)(ii)(L)C(II)(i)(K)D(II)(i)(K)
Energy Level Of Hydrogen Atoms
View SolutionTotal different spectral lines observed in between 11th excited state and 3rd energy level in H-atom emission spectrum are:
View SolutionHydrogen Spectrum & it's types || Different series in hydrogen spectrum
View SolutionBalmer series of hydrogen line emission spectrum lies in
View Solutionvisible line of hydrogen spectrum will be
View Solution
