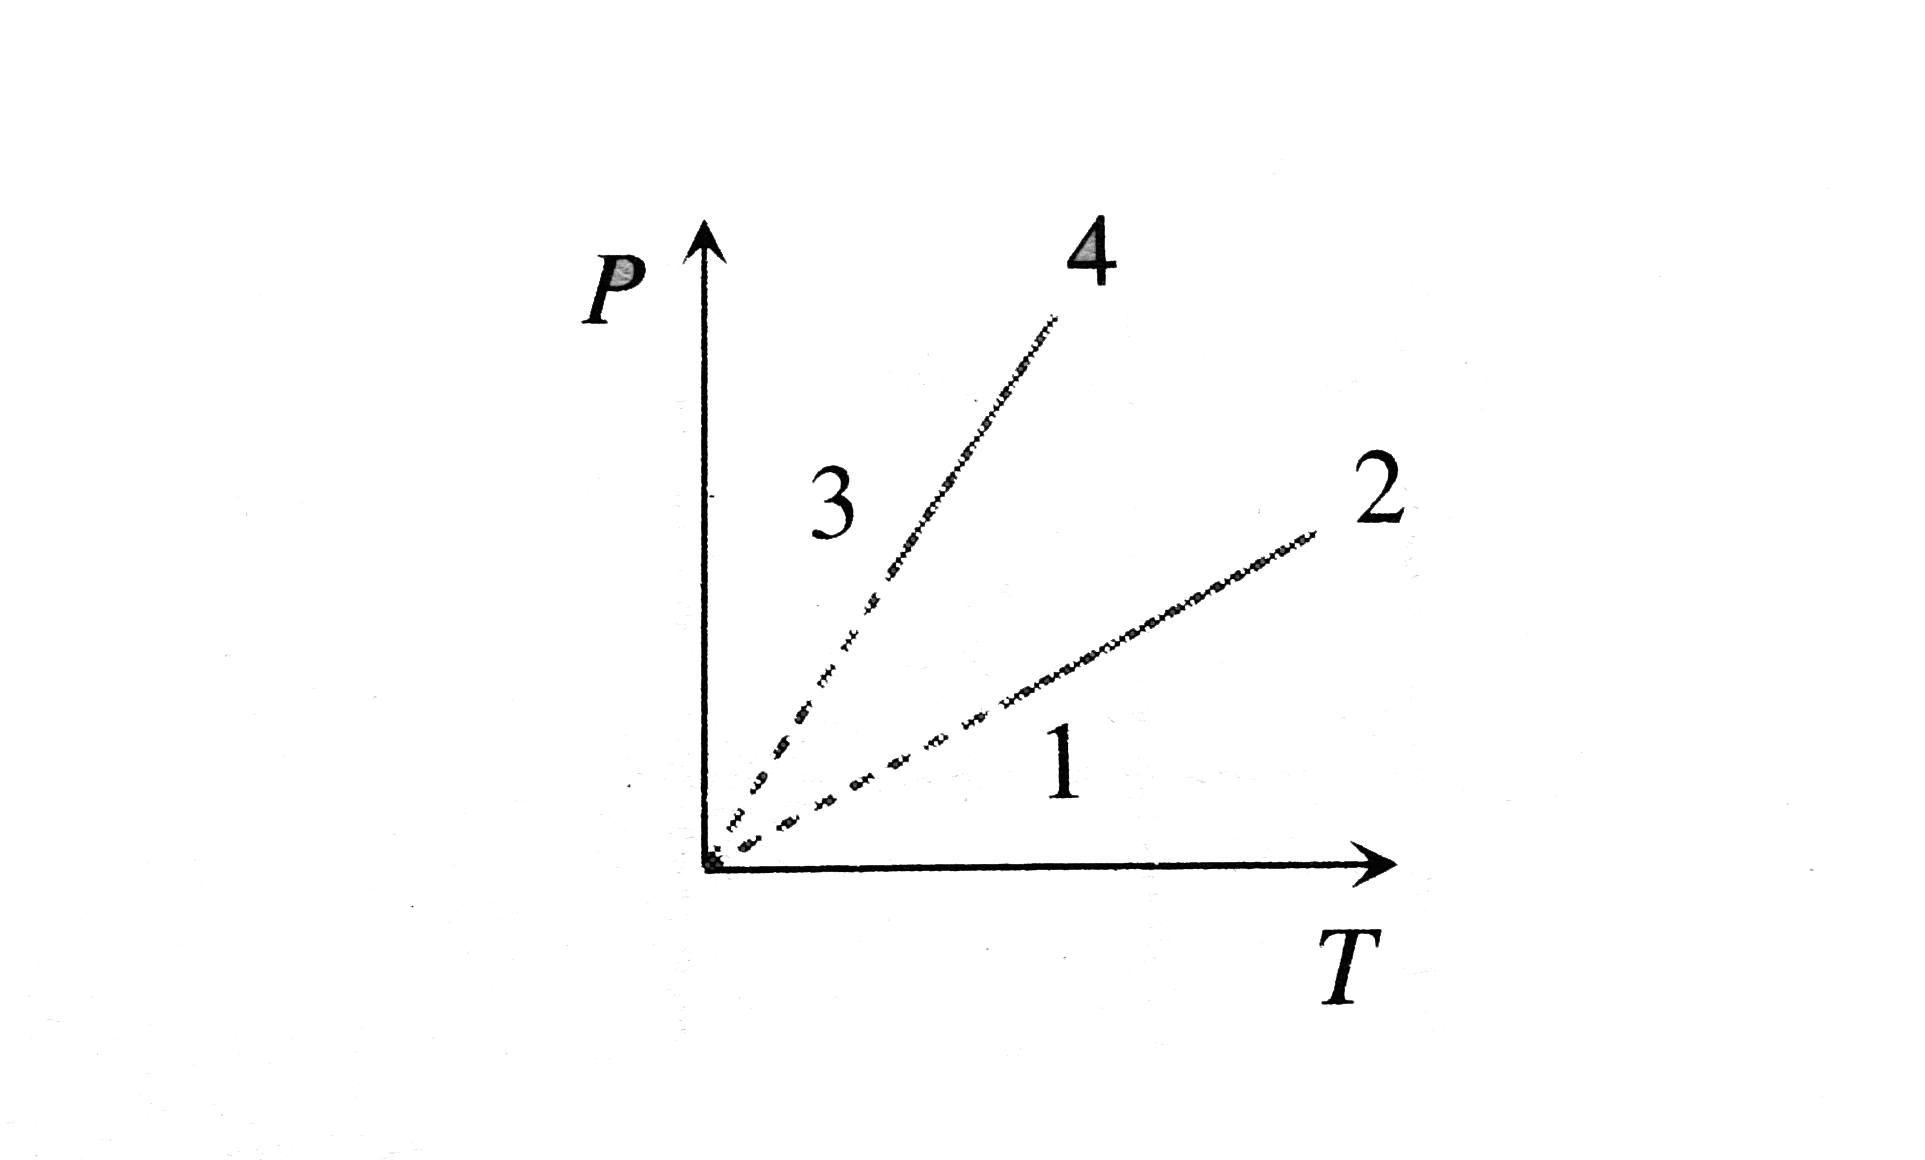
Pressure versus temperature graph of an ideal gas of equal number of moles of different volumes are plotted as shown in figure. Choose the correct alternative.

V1=V2=V3=V4
V4>V3>V2>V1
V1=V2,V3=V4 and V2>V3
V1=V2,V3=V4 and V2>V3
The correct Answer is:C
As P-T graphs are straight lines, passing through origin, thereforeP∝T. But as P=(μRV)T, therefore, the slope of straight line ∝1V
As (Slope)12<(Slope)34∴V2>V3
As for a given slope, Vis constant, therefore,
V1=V2 and V3=V4
Correct choice is (c).
Topper's Solved these Questions
- PROPERTIES OF MATTERBOOK - MODERN PUBLICATIONCHAPTER - PROPERTIES OF MATTEREXERCISE - MULTIPLE CHOICE QUESTIONS (LEVEL-II)
72 Videos
- PROPERTIES OF MATTERBOOK - MODERN PUBLICATIONCHAPTER - PROPERTIES OF MATTEREXERCISE - MULTIPLE CHOICE QUESTIONS (LEVEL-III)
13 Videos
- OSCILLATIONSBOOK - MODERN PUBLICATIONCHAPTER - OSCILLATIONSEXERCISE - RCQ
7 Videos
- RAY OPTICSBOOK - MODERN PUBLICATIONCHAPTER - RAY OPTICSEXERCISE - RECENT COMPETITIVE QUESTION
32 Videos
Similar Questions
Pressure versus temperature graph of an ideal gas of equal number of moles of different volumes is plotted as shown in Fig. Choose the correct alternative.
View SolutionVolume versus temperature (V-T) graph of an ideal gas of equal number of moles is plotted as shown in the figure. Choose the correct alternative.
View Solution
Knowledge Check
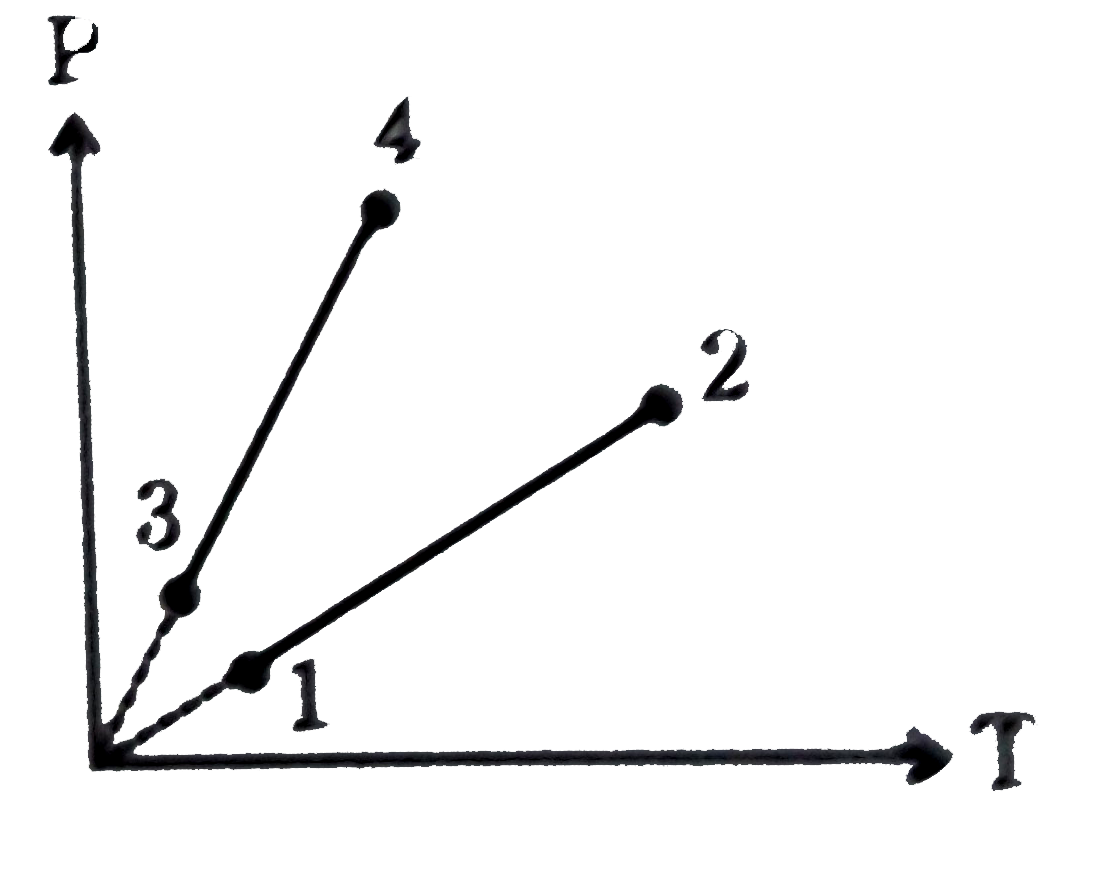
Pressure versus temperature graph of an ideal gas of equal number of moles of different volumes is plotted as shown in figure. Choose the correct alternatives.
 AV1=V2,V3=V4 and V2>V3BV1=V2,V3=V4 and V2<V3CV1=V2=V3=V4DV4>V3>V2>V1
Pressure versus temperature graph of an ideal gas of equal number of moles of different volumes is plotted as shown in Fig. Choose the correct alternative.
 AV1=V2,V3=V4 and V2>V3BV1=V2,V3=V4 and V2<V3CV1=V2,V3=V4DV4=V3>V2>V1
Pressure versus temperature graph of an ideal gas of equal number of moles of different volumes is plotted as shown in Fig. Choose the correct alternative.
 AV1=V2=V3=V4BV4>V3>V2>V1CV1=V2,V3=V4andV2>V3DV1=V2,V3=V4andV2<V3
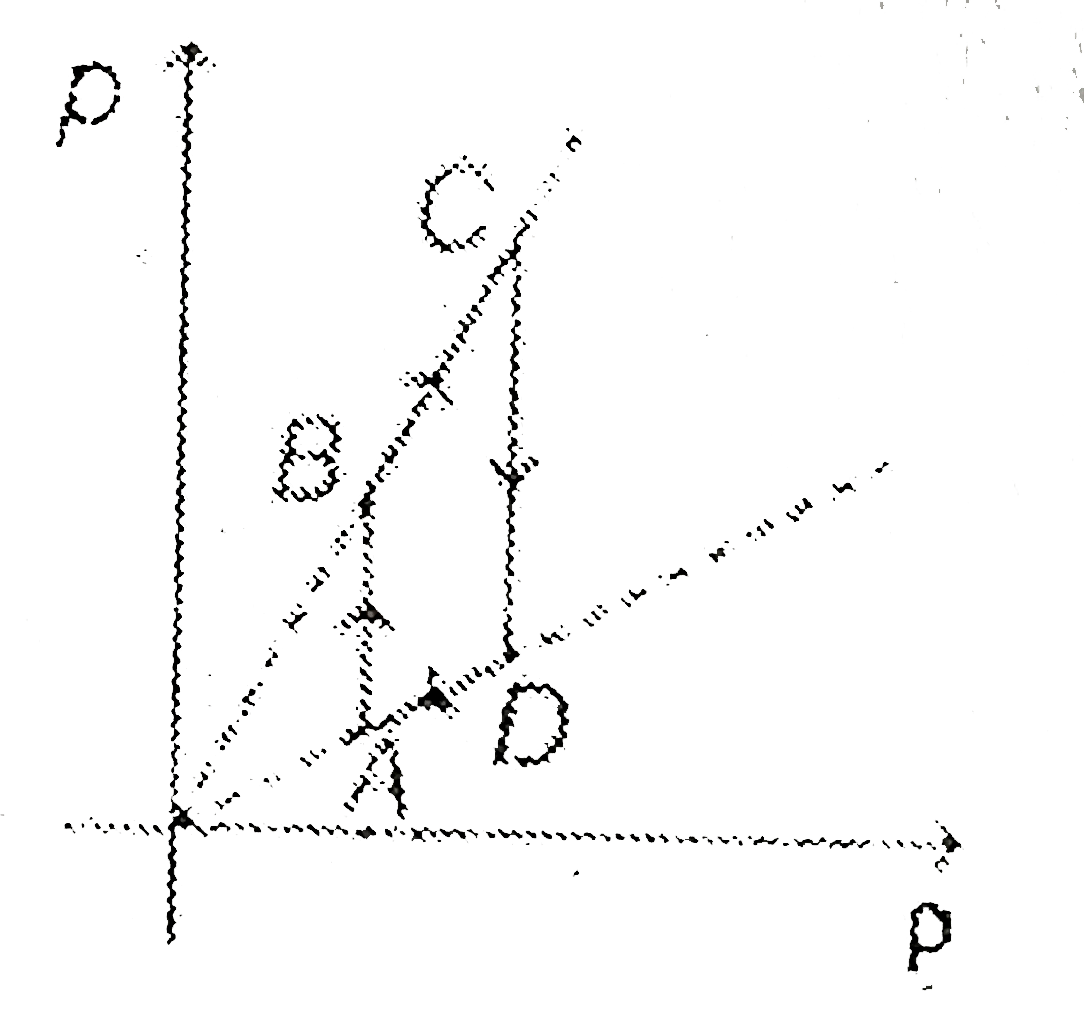
Pressure versus density graph of an ideal gas is shown in figure
View Solution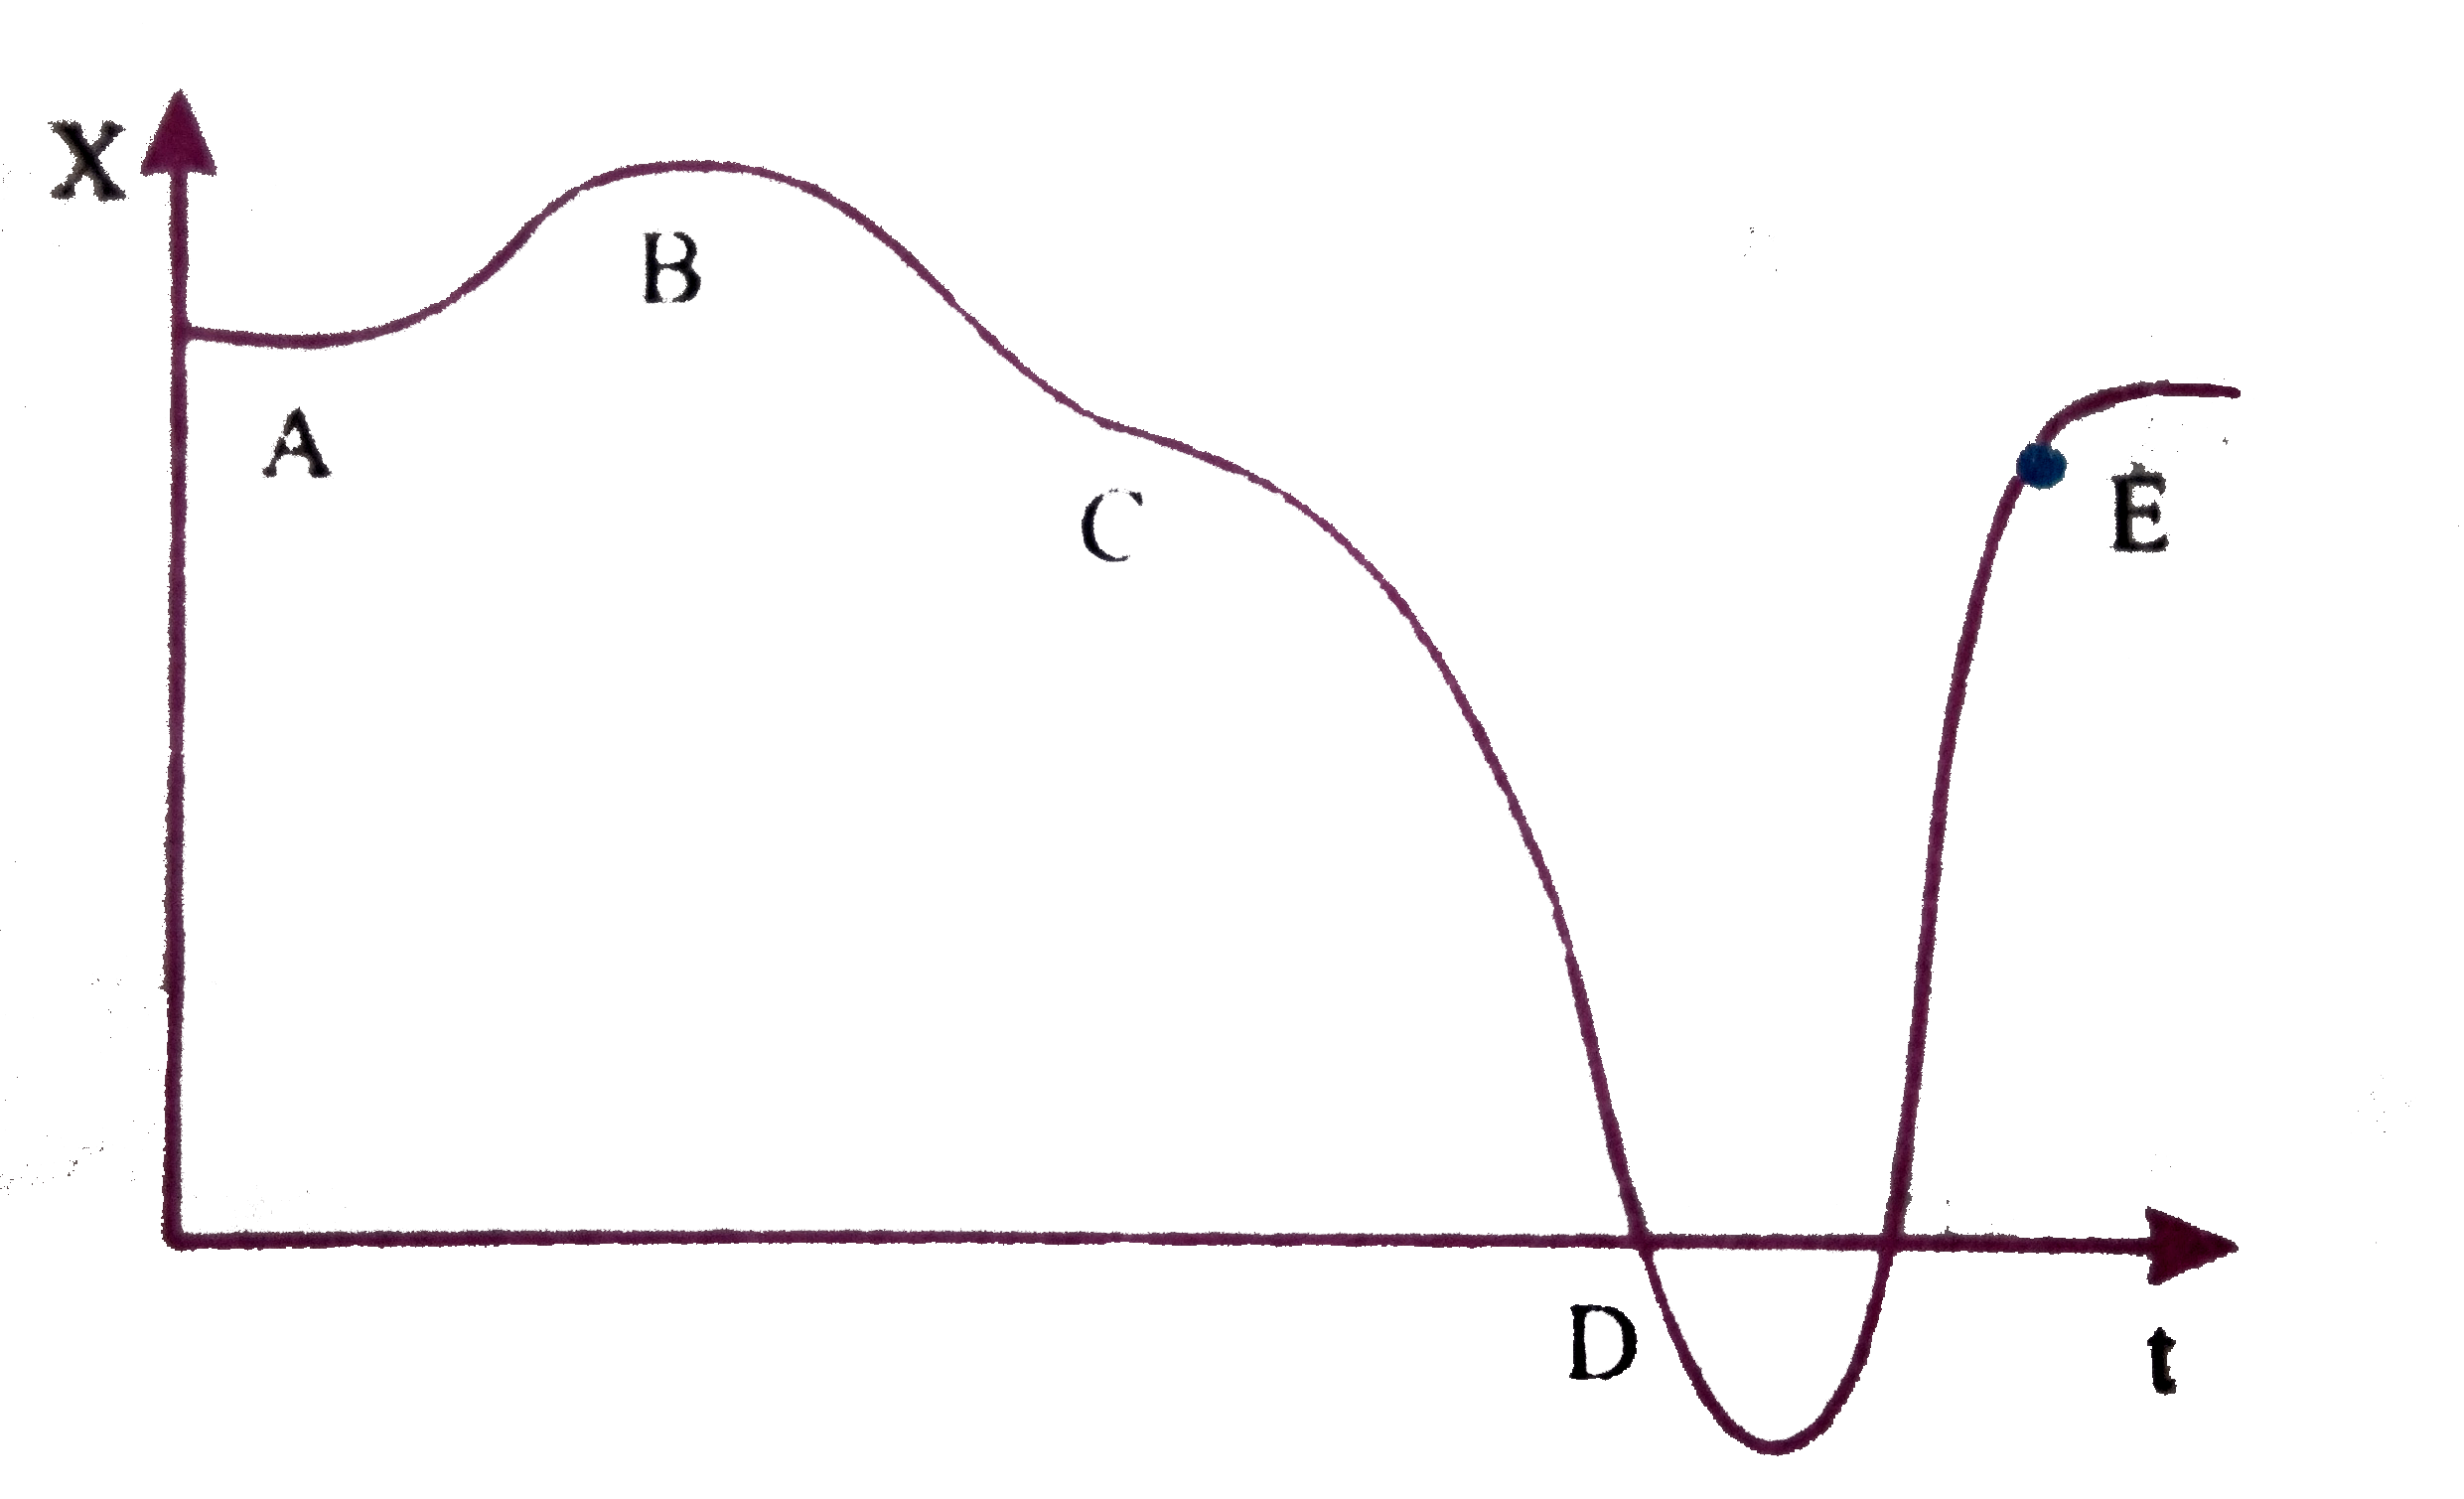
A graph of x versus t is shown in figure. Choose correct alternative from below.
View SolutionPressure versus temperature graphs of an ideal gas are as shown in figure. Choose the wrong statement
View SolutionPressure versus density graph of an ideal gas is shown in figure

View Solution
A graph of x versus t is shown in figure. Choose correct alternative from below.
View Solution
