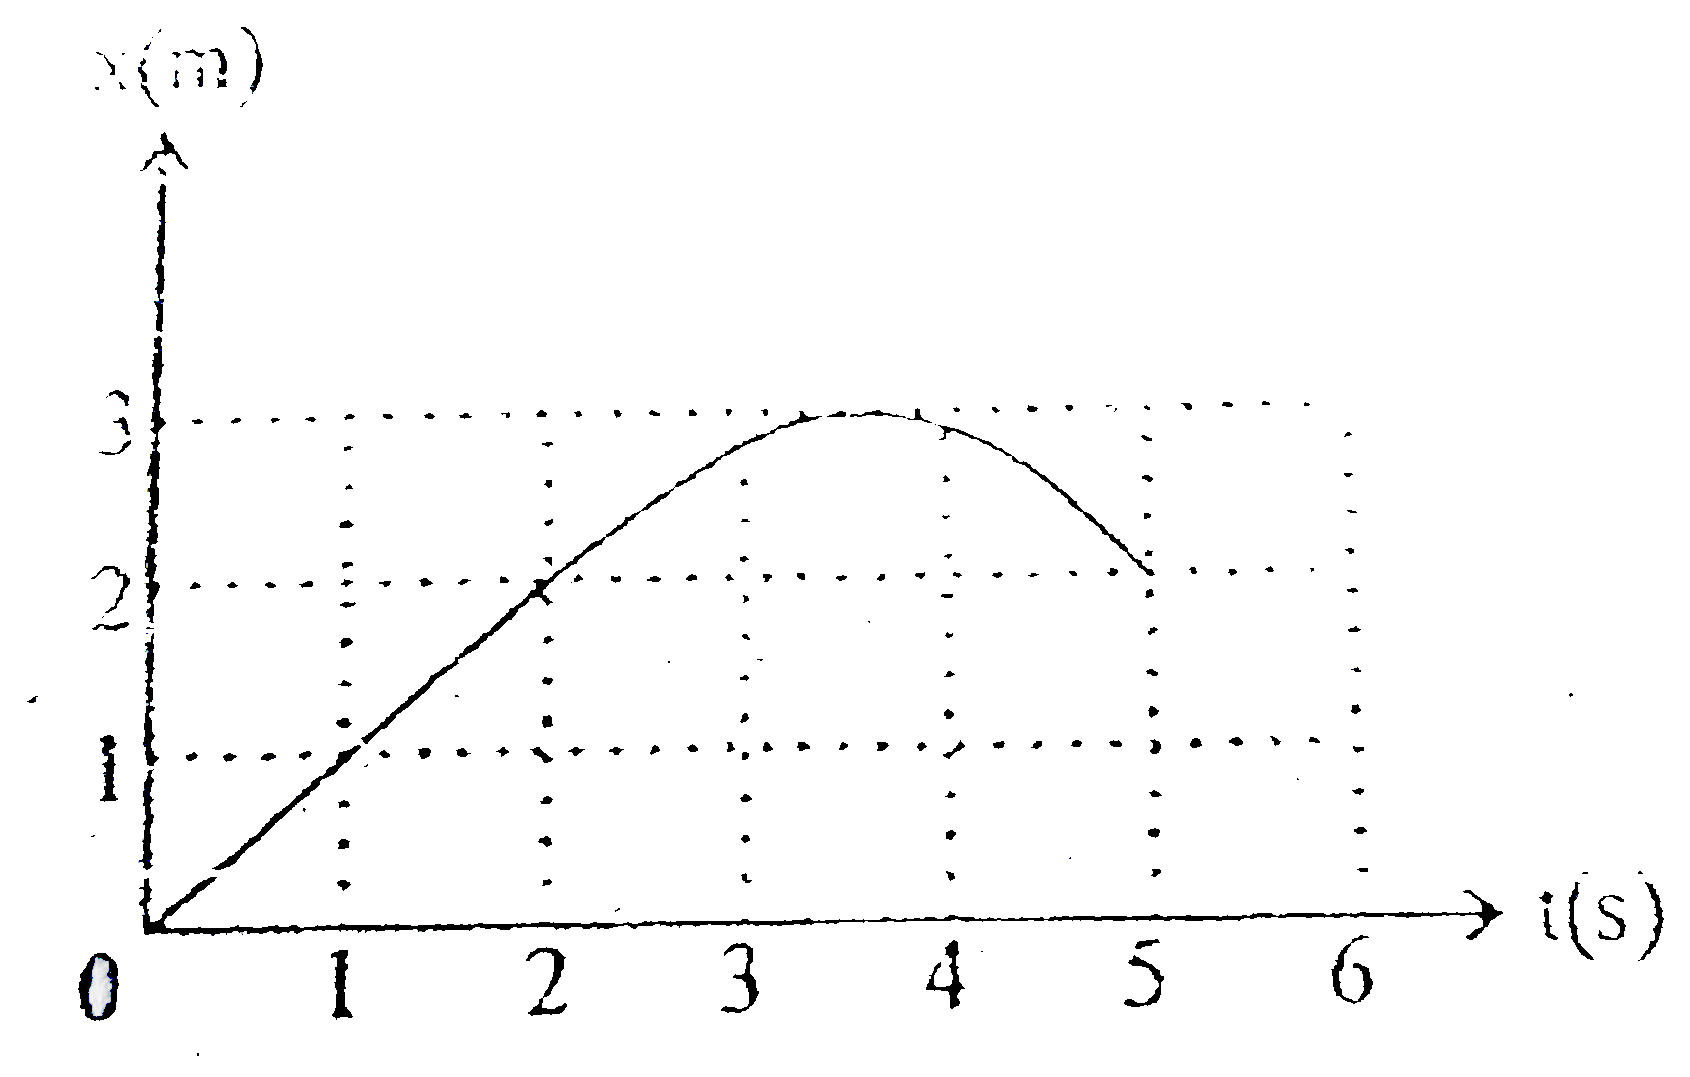
The position- time (x-t) graphs for two rabbits A and B moving from their carrot field O to their homes P and Q respectively along straight line path (taken as x axis ) are shown in figure below. Choose the correct statement(s):
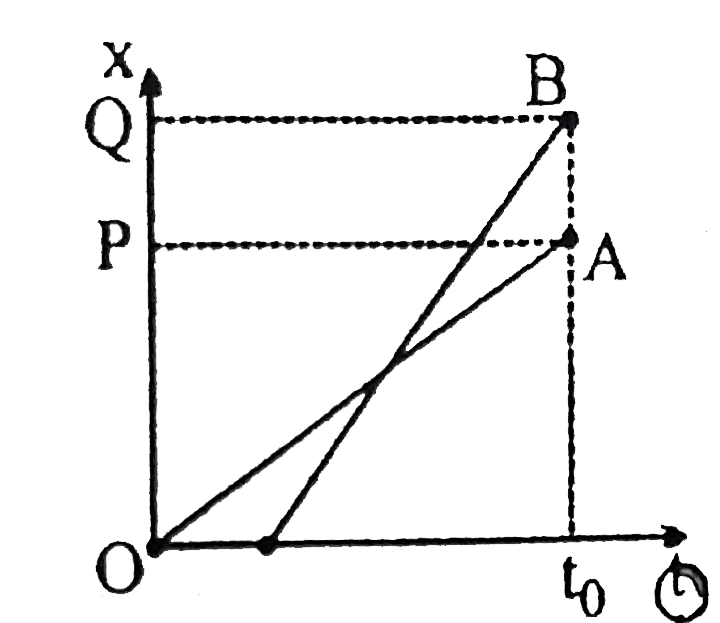
A lives closer to the carrot field than B
A starts form the carrot field earlier than B
A and B have equal average velocities form 0 tot0
B overtakes A on the way
The correct Answer is:A, B, C
Step by step video & image solution for The position- time (x-t) graphs for two rabbits A and B moving from their carrot field O to their homes P and Q respectively along straight line path (taken as x axis ) are shown in figure below. Choose the correct statement(s): by Maths experts to help you in doubts & scoring excellent marks in Class 12 exams.
Updated on:21/07/2023Topper's Solved these Questions
- TEST PAPERSBOOK - BANSALCHAPTER - TEST PAPERSEXERCISE - CHEMISTRY
133 Videos
- TEST PAPERSBOOK - BANSALCHAPTER - TEST PAPERSEXERCISE - MATHEMATICS
58 Videos
- TEST PAPERSBOOK - BANSALCHAPTER - TEST PAPERSEXERCISE - MATHS SECTION - 2 [MULTIPLE CORRECT CHOICE TYPE]
6 Videos
- PROBABILITYBOOK - BANSALCHAPTER - PROBABILITYEXERCISE - All Questions
1 Video
- THERMODYNAMICSBOOK - BANSALCHAPTER - THERMODYNAMICSEXERCISE - Match the column
7 Videos
Similar Questions
The position-time (x-t) graphs for two children A and B returning from their school O to their homes P and Q, respectively, are shown in figure. P Choose the correct answer.

(i) A and B reach home at the (same/different) time.
(ii) A or B overtakes on the road (once/twice).
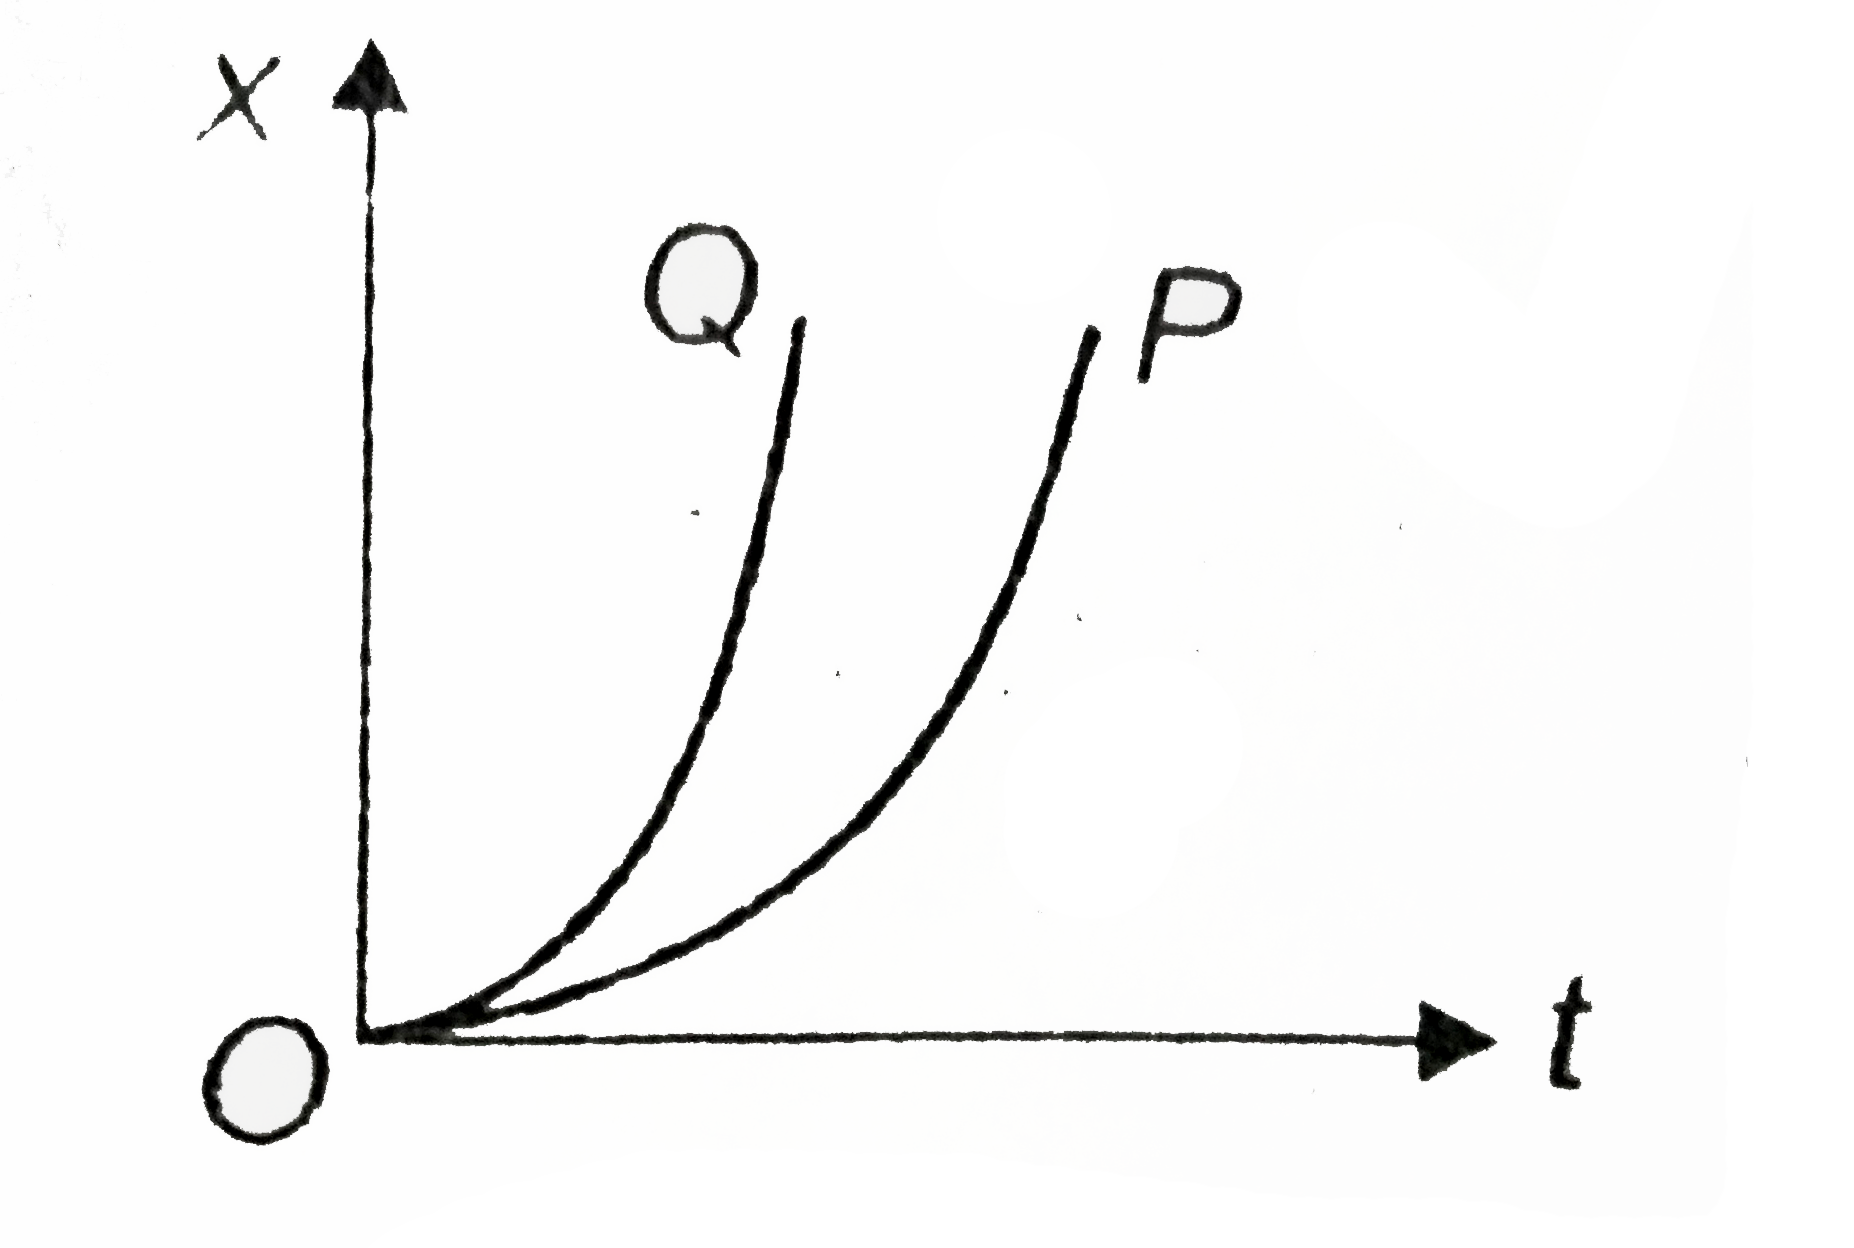
View SolutionThe position-time graph for two particles P and Q moving on x-axis is shown in the figure. Then
View Solution
Knowledge Check
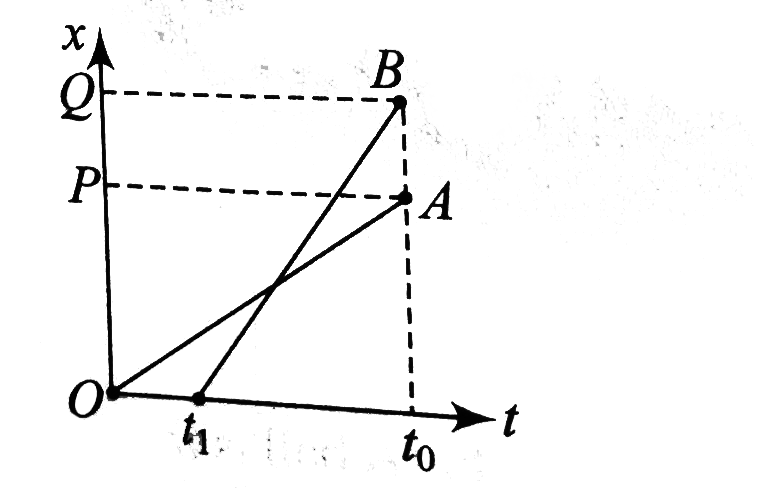
The position-time (x-t) graphs for two children A and B returning from their school O to their homes P and Q respectively along straight line path (taken as x-axis) are shown in figure. Choose the correct statement (s):AA lives closer to the school BBA starts from the school earlier than BCA and B have equal average velocities from 0 to t0.DB overtakes A on the wayA graph of x verus t is shown in the figure given below. Choose correct alternatives from below.
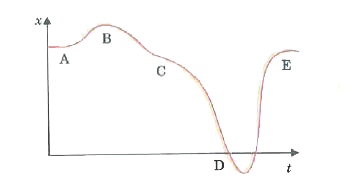 AThe particle was released from rest at t = 0 .BAt B, the acceleration a>0 .CAt C, the velocity and the acceleration vanish .DAverage velocity for the motion between A and D is positive .
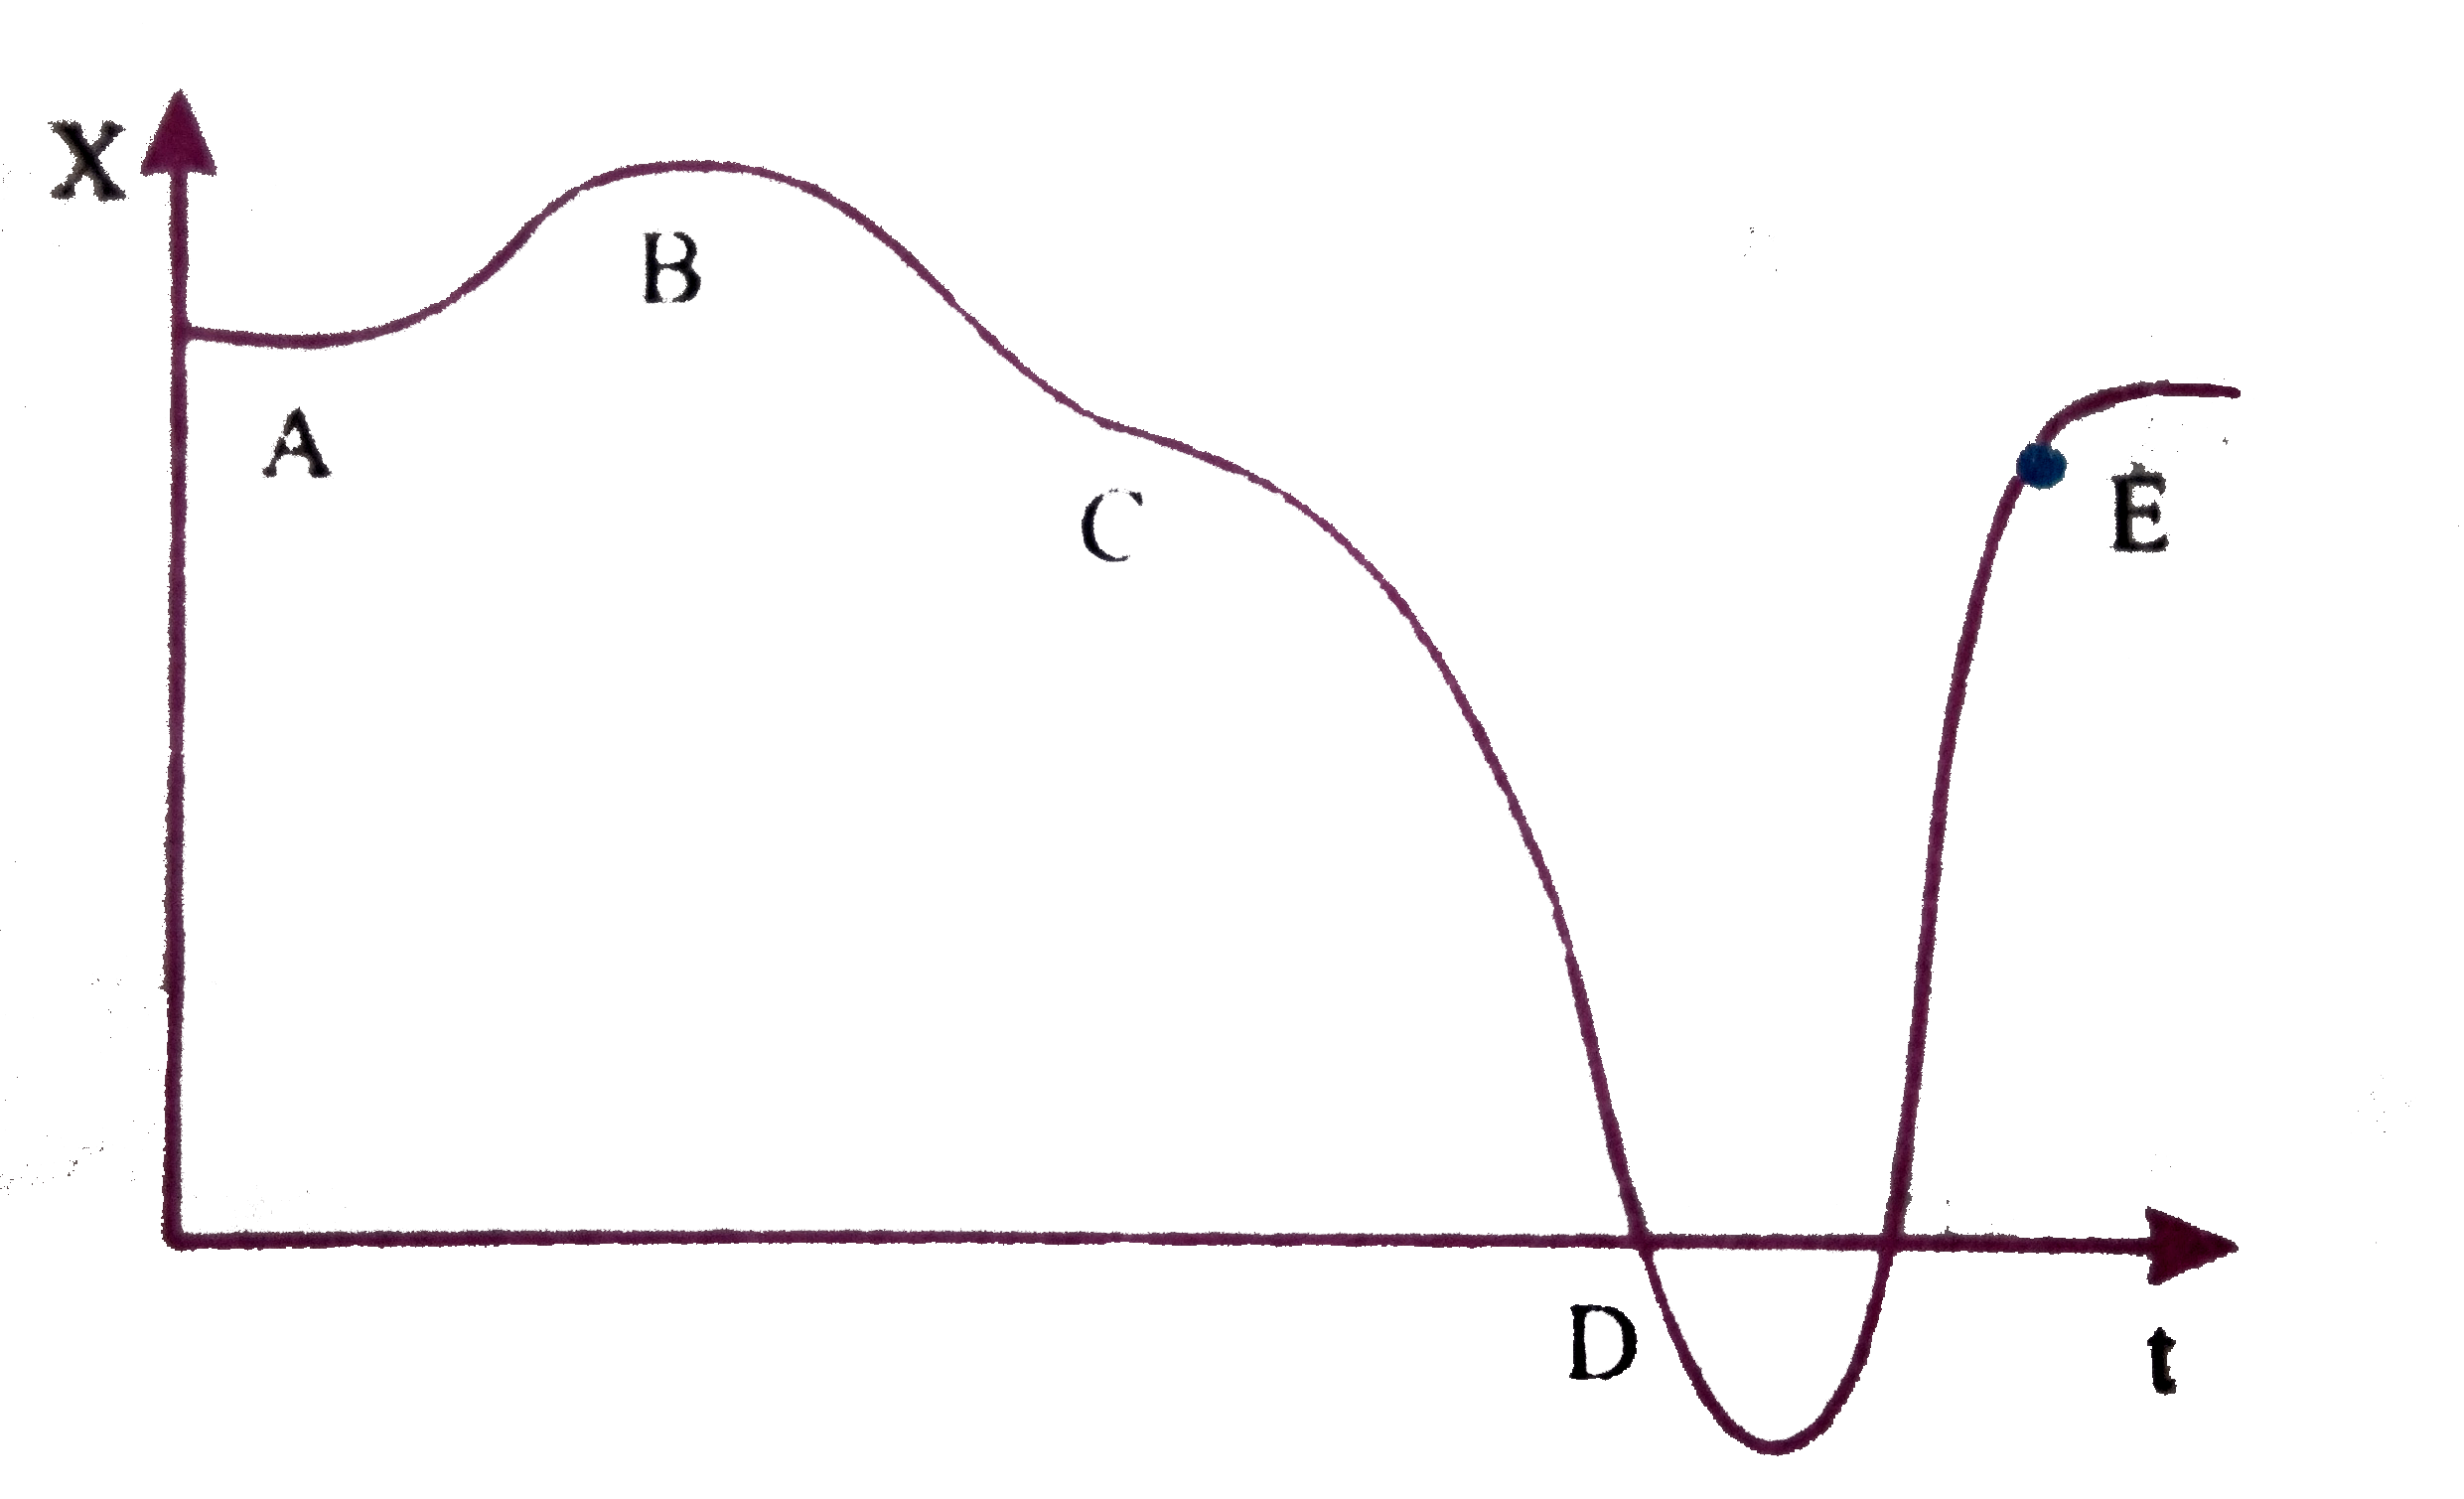
A graph of x versus t is shown in figure. Choose correct alternative from below.AThe particle was released from rest at t=0BAt B, the accleration a>0CAverage velocity for the motion between A and D is positive.DThe speed at D exceeds that at E.
Draw position-time graphs for two objects having zero relative velocity.
View SolutionFor a particle moving along x-axis, a scaled x-6 graph is shown in figure. Mark the correct statement (s).
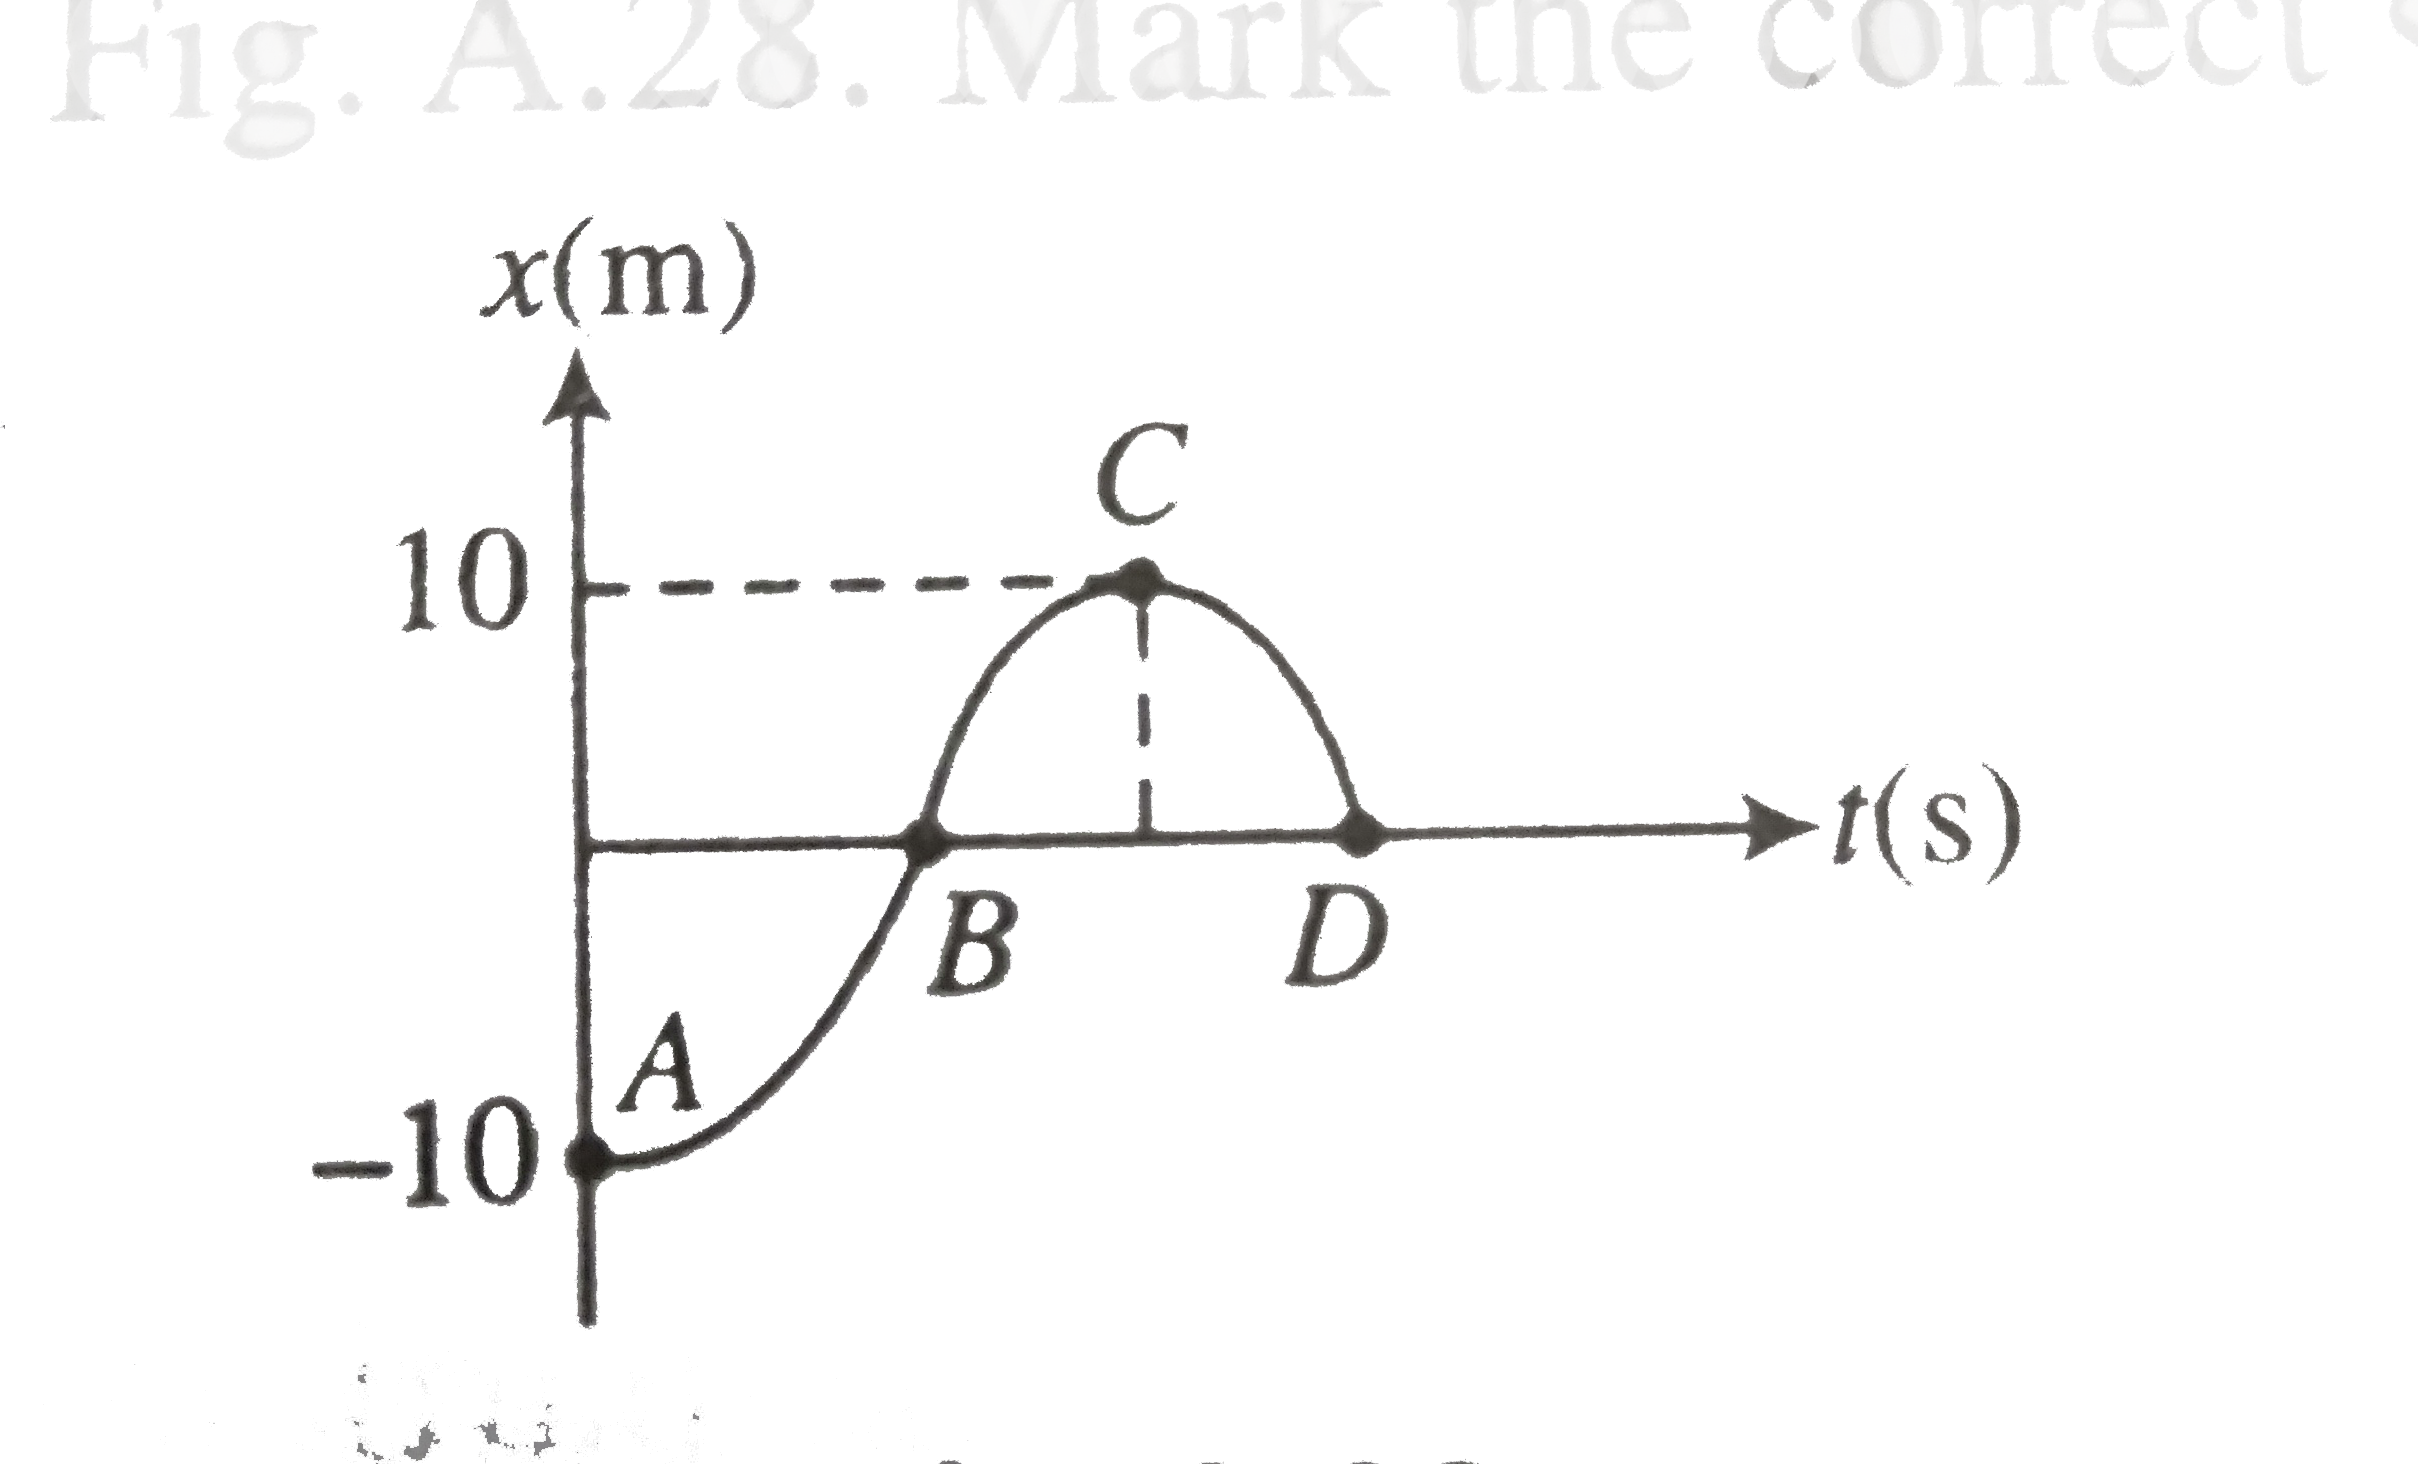
View SolutionDisplacment-time graph of a particle moving in a straight line is as shown in figure. Choose the INCORRECT statement(s)
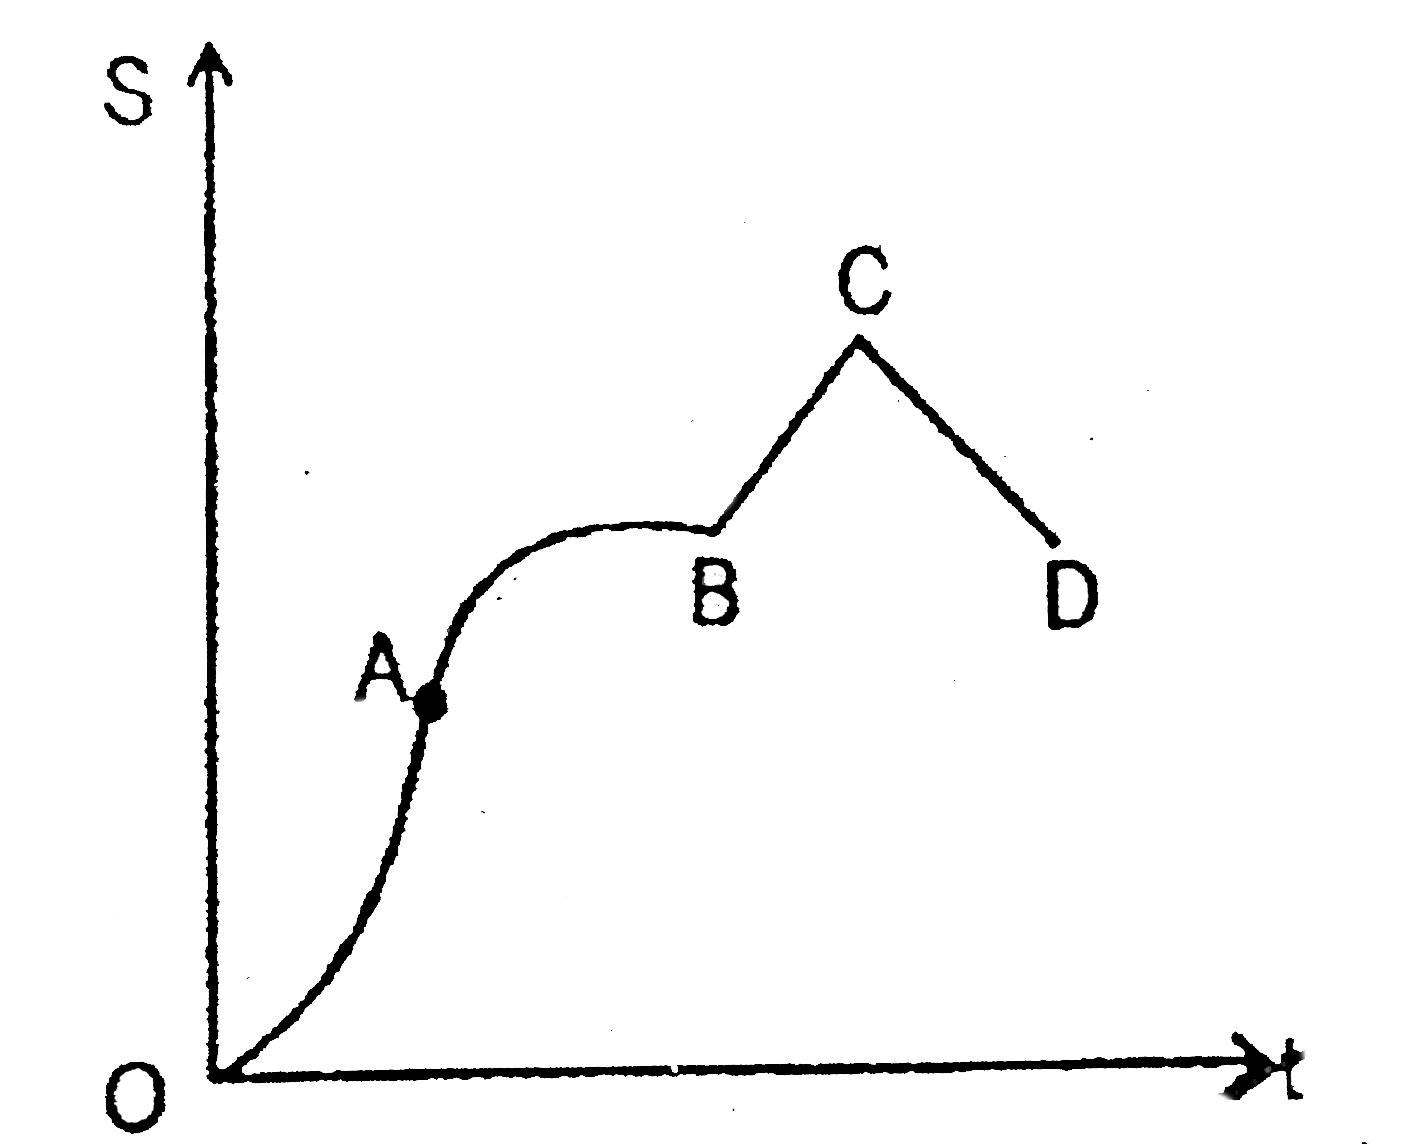
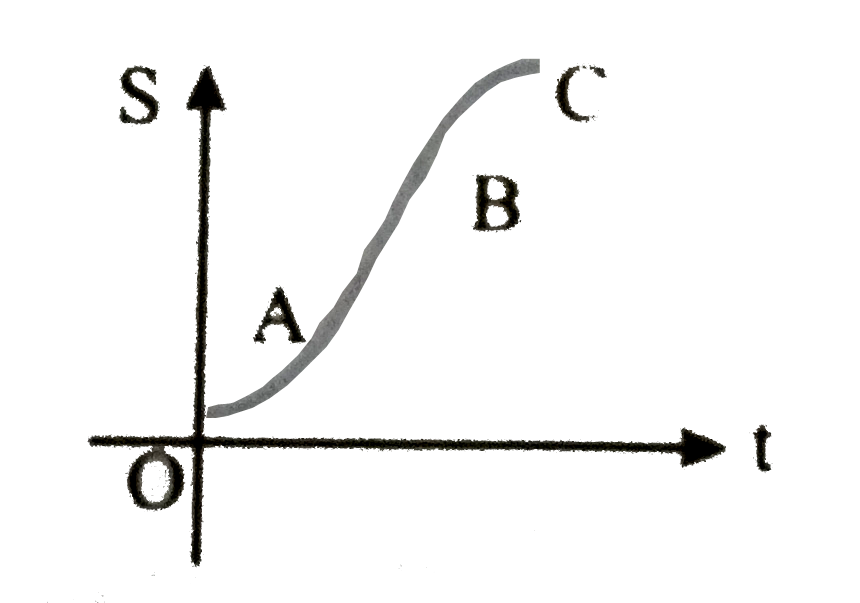
View SolutionDisplacement time graph of a particle moving in a straight line is as shown in figure. Select the correct alternative (s) :
 .
.
View SolutionA particle moved along the X−axis according to the graph shown in Figure. Choose the incorrct options.
View Solution