Which of the following plots represents an ideal binary mixture ?
A
Plot of is linear (= mole fraction of 'B' in liquid phase).
B
Plot of is linear ( = mole fraction of 'A' in vapour phase)
C
Plot of is linear
D
Plot of is non linear
Text Solution
The correct Answer is:A, C
|
Similar Questions
Knowledge Check
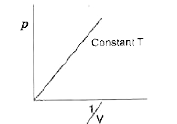
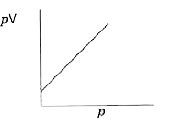
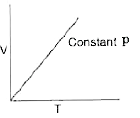
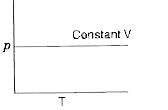
Which of the following plots are correct for an ideal gas ?
A B
B C
C D
D
Which of the following plots represents the behavior of an ideal binary liquid solution ?
APlot of PtotalvsyA (mole fraction of A in vapour) is linearBPlot ofPtotalvsyB is linearCplot of 1/PtotalvsyA is linearDPlot of 1/PtotalvsyB is non linear.Which of the following plots represents an exothermic reaction?
A B
B C
C D
D
Which of the following plots represents an exothermic reaction?
View SolutionWhich of the following plots represents the behavior of an ideal binary liquid solution ?
View SolutionWhich of the following represents a solid liquid mixture ?
View SolutionWhich of the following does not represent ideal gas equation?
View SolutionWhich of the following plots represents correctly the variation of conductivity with concentration?
View Solution
