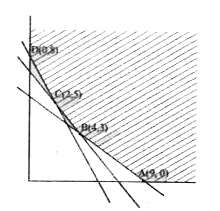
Feasible region of an L.P.P is shown shaded in the following figure. Minimum of Z=4x+3y occurs at the point.
 Solution in Tamil
(0,8)
(2,5)
(4,3)
(9,0)
The correct Answer is:B
Step by step video, text & image solution for Feasible region of an L.P.P is shown shaded in the following figure. Minimum of Z=4x+3y occurs at the point. by Maths experts to help you in doubts & scoring excellent marks in Class 12 exams.
Topper's Solved these Questions
- BOOK - NEW JOYTHI PUBLICATIONCHAPTER - LINEAR PROGRAMMING EXERCISE - UNIT TEST6videos
LINEAR PROGRAMMING
- BOOK - NEW JOYTHI PUBLICATIONCHAPTER - LINEAR INEQUALITIESEXERCISE - QUESTIONS FROM COMPETITIVE EXAMS38videos
LINEAR INEQUALITIES
- BOOK - NEW JOYTHI PUBLICATIONCHAPTER - MATHEMATICAL REASONINGEXERCISE - QUESTION FROM COMPETITIVE EXAMS23videos
MATHEMATICAL REASONING
Similar Questions
A company combines two items A and B from gift packs during a festival season. Each pack must weight atleast 5 kg and should contain atelast 2 kg of A and not more than 4 kg of B. The net contribution of the company is Rs. 10 per kg of A and Rs 12 per kg of B. the company wants to determine the optimum mix. By defining suitable variables, write
i. the objective function
ii. The constraints01:37View SolutionThe set of all x satisying the inequility 4x−13x+1≥1 is
02:11View SolutionThe statement ~(p→q) is equivalent to
01:31View SolutionHow many lines of symmetry does the above figure have ?
02:45View SolutionDetermine the point of symmetry of a regular hexagon.
02:17View SolutionDtermine the images of the following figure about the given line :
05:41View SolutionMatch the following Column A to Column B
 02:03View Solution
Match the following Column A to Column B
 02:10View Solution
Match the following Column A to Column B
 02:17View Solution
The area of the shaded part in the figure given below is ______.
 02:10View Solution
The inequation represented by the graph given below is :
04:23View SolutionThe inequation that best describes the graph given below is _________
01:59View SolutionThe inequation that best describes the following graph is _________
01:19View SolutionWhich inequations represent the shaded region in the given figure
02:41View SolutionThe equation of straight line shown in figure is :
ltimg src="https://d10lpgp6xz60nq.cloudfront.net/physics_images/ALN_PHY_R04_E01_020_Q01.png" width="80%"gt01:45View Solution

