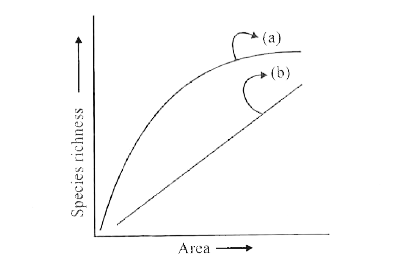
A graph on species richness is given below. Complete the equations (a) and (b) according to Alaxander von Humboldt.
 Solution in Tamil
a. Log S = log C + Z log A
b. S=CAZ
S - Species richness, A - Area, Z - Slope of the line (regression coefficient), C = Y intercept
Topper's Solved these Questions
- BOOK - NEW JOYTHI PUBLICATIONCHAPTER - BIODIVERSITY AND CONSERVATION EXERCISE - QUESTIONS FROM EDUMATE4videos
BIODIVERSITY AND CONSERVATION
- BOOK - NEW JOYTHI PUBLICATIONCHAPTER - BIODIVERSITY AND CONSERVATION EXERCISE - PREVIOUS YEAR HSE QUESTIONS9videos
BIODIVERSITY AND CONSERVATION
- BOOK - NEW JOYTHI PUBLICATIONCHAPTER - BIODIVERSITY AND CONSERVATION EXERCISE - PREVIOUS YEAR COMPETITIVE EXAM QUESTIONS17videos
BIODIVERSITY AND CONSERVATION
- BOOK - NEW JOYTHI PUBLICATIONCHAPTER - BIOTECHNOLOGY : PRINCIPLES AND PROCESSES EXERCISE - CBSE Corner12videos
BIOTECHNOLOGY : PRINCIPLES AND PROCESSES
Similar Questions
Read the paragraph given below. Based on the paragraph and your acquired knowledge and understanding, answer the question.
''A traditional strategy for the protection of biodiversity has been in practice in India and some other Asian countries dimensions protected by tribal communities due to religious sanctity accorded to them. The sacred forests represent islands of pristine forests and have been free from all disturbances, though these are frequently surrounded by highly degraded landscape. In India, sacred forests are located in several parts e.g. Karnataka, Maharashtra, Kerala, Meghalaya etc and are serving as refugia for number of rare, endangered and endemic taxa.''
a. In India which are the major locations of sacred forests?
b. By considering a sacred forest in your local area, list any two ecological significances of sacred forests.
c. Due to the religious sanctity, sacred forests are protected to a certain extent. Do you agree? Justify your opinion.01:50View SolutionIndia is developing industrially and economically. Do you agree with this type of development from an ecological perspective? Why?
01:44View SolutionWhich of these is an in-situ method of conservation?
03:06View SolutionThe enzyme used to cut the DNA molecule is
02:31View Solutionएलैक्जैंडर वॉन हमबोल्ट ने सर्वप्रथम क्या वर्णित किया?
02:42View SolutionAlexander von Humboldt gave the relationship between the species richness and its geographical area . Which of the following is the correct logarithmic equation for his findings ?
02:38View SolutionAccording to Alexander von Humboldt:
02:26View SolutionRivert popper hypothesis was given by
(a) Paul Ehrlich
(b) Alexander von Humboldt
(c) David Tilman
(d) Robert May05:00View SolutionDescribe the relation between species richness and Von area.
02:54View Solutionwrite the concept of Alexander Von Humboldt on Agriculture.
03:06View SolutionAccording to Alexander von Humboldt:
02:07View SolutionAlexander von Humboldt is associated with
(a.) species - area relationship
(b.) log S = log C + z logA
(C.) Within a region , species richness increases with the increasing limited explored area.
(d.) Increased diversity contributes to higher productivity.
(e.) Species diversity increases with the loss of keystone species.01:50View SolutionAlexander von Humboldt gave the relationship between the species richness and its geographical area . Which of the following is the correct logarithmic equation for his findings ?
01:50View SolutionAccording to Alexander von Humboldt:
03:32View SolutionAlexandar Von Humboldt described for the first time:
03:32View Solution

