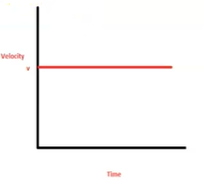
From this velocity-time graph, which of the following is correct?
 Solution in Tamil
a)Constant acceleration
b)Variable acceleration
c)Constant velocity
d)Variable velocity
The correct Answer is:A, B, C
Step by step video & image solution for From this velocity-time graph, which of the following is correct? by Physics experts to help you in doubts & scoring excellent marks in Class 11 exams.
Updated on:21/07/2023Topper's Solved these Questions
- KINEMATICSBOOK - FULL MARKSCHAPTER - KINEMATICSEXERCISE - ADDITIONAL QUESTIONS SOLVED (SHORT ANSWER QUESTIONS - 1 (2 MARKS))
20 Videos
- KINEMATICSBOOK - FULL MARKSCHAPTER - KINEMATICSEXERCISE - ADDITIONAL QUESTIONS SOLVED (NUMERICAL QUESTIONS)
42 Videos
- KINEMATICSBOOK - FULL MARKSCHAPTER - KINEMATICSEXERCISE - TEXTUAL QUESTIONS SOLVED (LONG ANSWER QUESTIONS)
14 Videos
- HEAT AND THERMODYNAMICSBOOK - FULL MARKSCHAPTER - HEAT AND THERMODYNAMICSEXERCISE - ADDITIONAL QUESTIONS SOLVED (Numerical Problems)
16 Videos
- KINETIC THEORY OF GASESBOOK - FULL MARKSCHAPTER - KINETIC THEORY OF GASESEXERCISE - Addtional Numerical Problems
10 Videos
Similar Questions
What are positive and negative acceleration in straight line motion?
View SolutionThe V-t graphs of two objects make angle 30∘ and 60∘ with the time axis. Find the ratio of their accelerations.
View SolutionExplain in detail the triangle law of addition.
View SolutionThe length of a metal wire is l1 when the tension in it is T1 and is l2 when the tension is T2. The natural length of the wire is:
View SolutionIf the rms speed of hydrogen molecules at 300K is1930ms−1. Then what is the rms speed of oxygen molecules at 1200K.
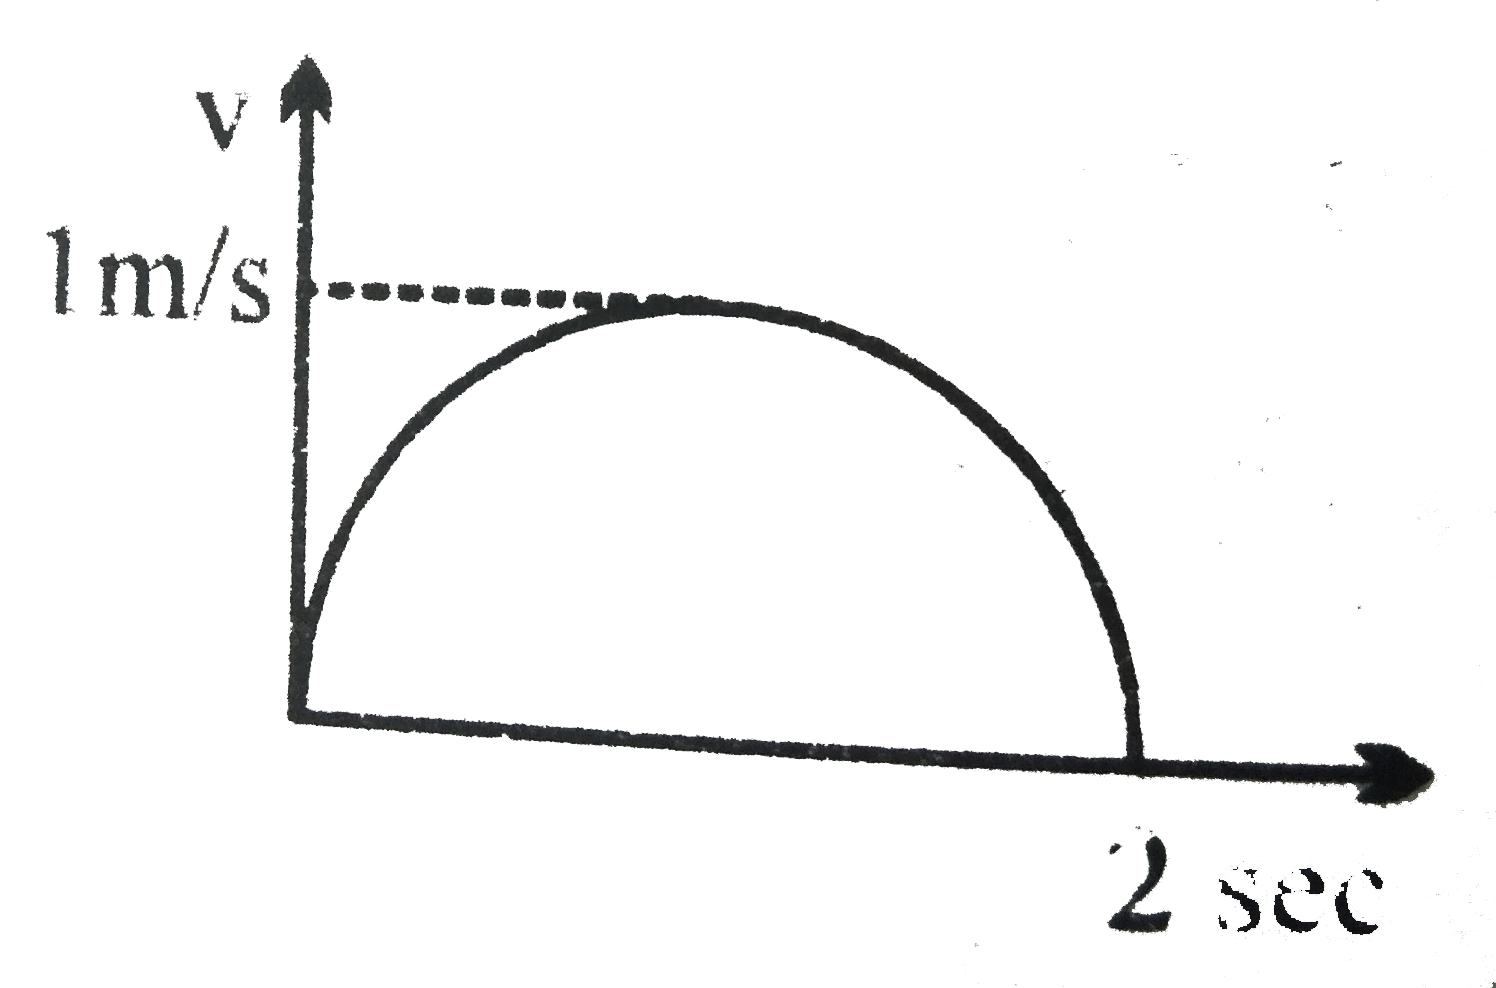
View SolutionVelocity-time graph for a car is semicircle as shown here. Which of the following is correct:
View SolutionA velocity-time graph of two vehicals A & B starting from rest at the same time is given in the figure. The statements which is correct from graph.
View SolutionA particle moves as shown in the following figure 1.104:
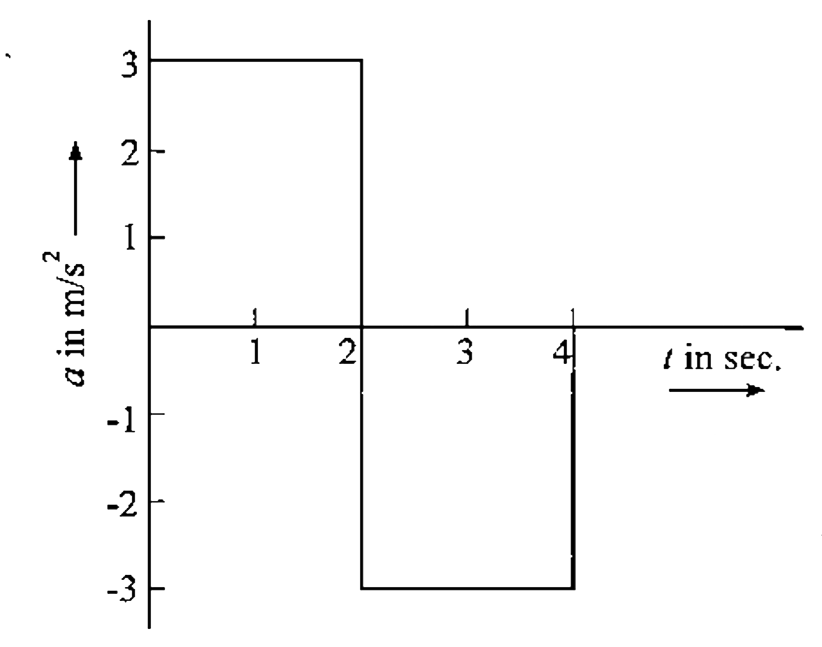
From the above curve the correct velocity-time graph for the interval of 4 seconds will be :
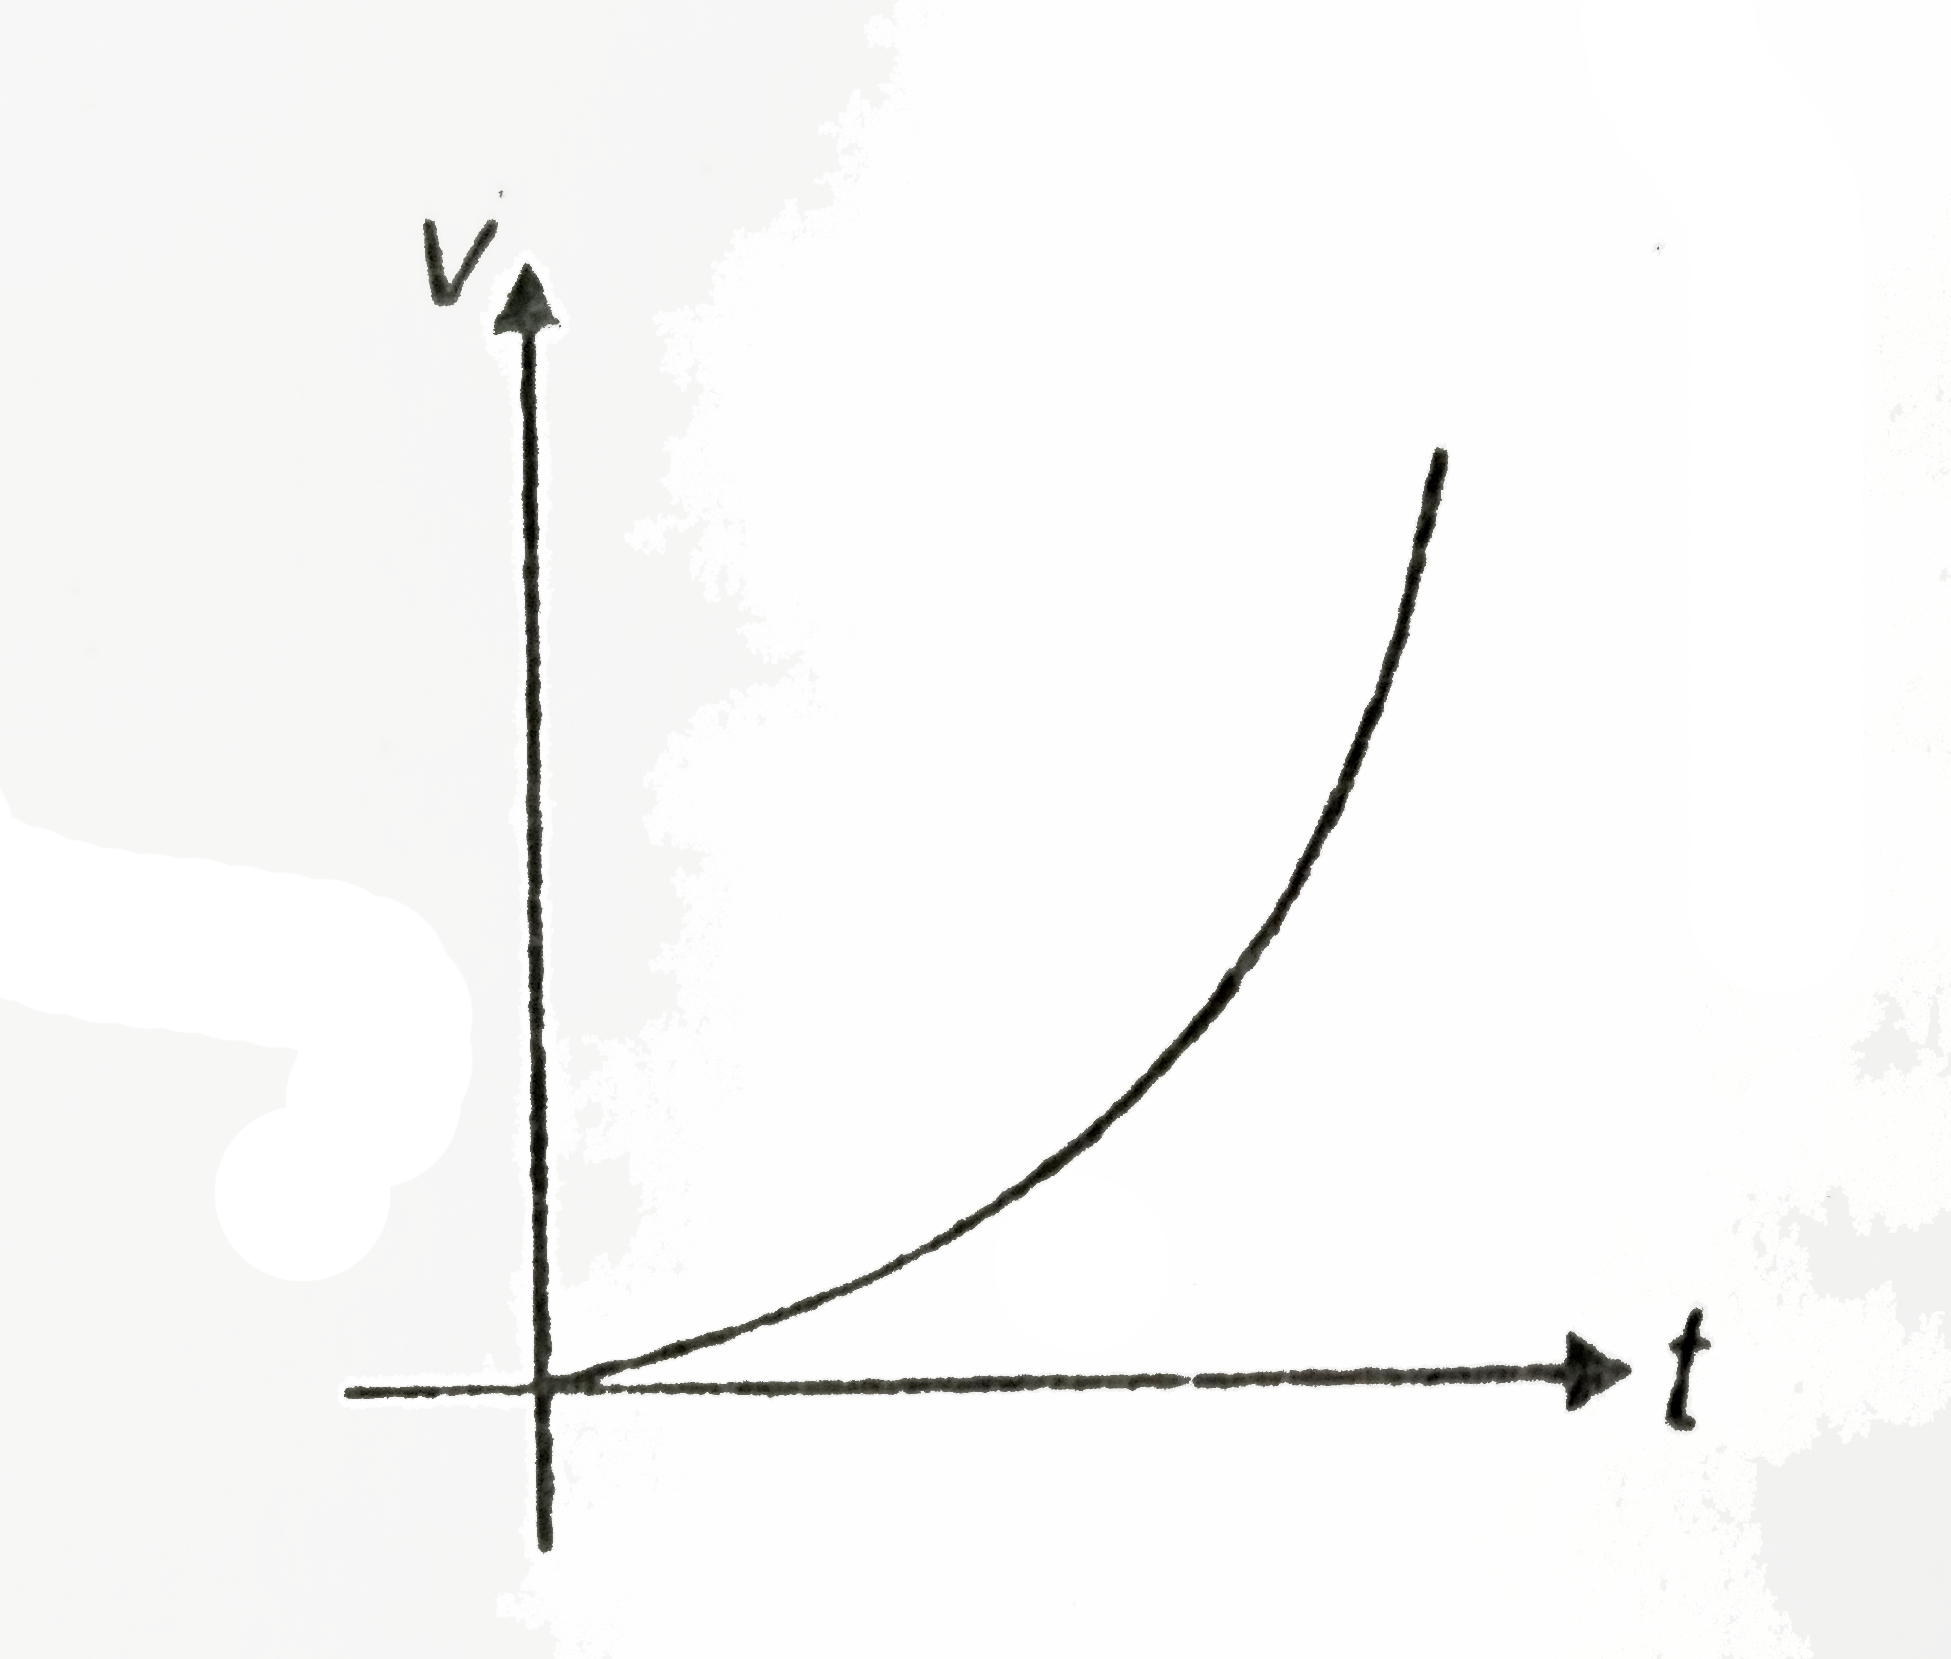
View SolutionGraphs are very useful to represent a physical situation. Various quantities can be easily represented on graphs and other quantites can be determined from the graph. For example the slope of velocity-time graph represents instantaneous acceleration. For a motion with constant acceleration slope of velocity-time graph is constant. If acceleration is changing with time, slope with change and thus velocity-time graph will be a non-linear curve. Further the area of velocity-time graph gives displacement.
For the given velocity-time graph the possibly correct acceleration-time relationship is
View SolutionWhich of the graph between velocity and time is correct ?
View Solutionनिम्नलिखित ग्राफों में कौन-सा एक पिण्ड जो श्यान द्रव में गिरता है के लिए वेग व समय के बीच सही ग्राफ को दर्शाता है?
View Solutionविस्थापन तथा समय के बीच निम्न ग्राफ प्राप्त होता है
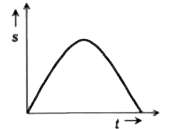
इसके संगत सही वेग-समय ग्राफ होगा
View SolutionWhich graph is correct in velocity and time in Question 47:
View SolutionAccording to question 52 above, which graph is correct in velocity and time:
View SolutionWhich of the following velocity-time graph is not possible?
View Solution
