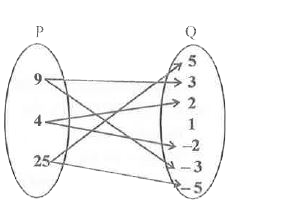
The figure shows a relation between the sets P and Q

write its domain and range Solution in Tamil
Step by step video & image solution for The figure shows a relation between the sets P and Q write its domain and range by Maths experts to help you in doubts & scoring excellent marks in Class 12 exams.
Updated on:21/07/2023Topper's Solved these Questions
- RELATIONS AND FUNCTIONS BOOK - NEW JOYTHI PUBLICATIONCHAPTER - RELATIONS AND FUNCTIONS EXERCISE - EXERCISE
25 Videos
- RELATIONS AND FUNCTIONS BOOK - NEW JOYTHI PUBLICATIONCHAPTER - RELATIONS AND FUNCTIONS EXERCISE - QUESTIONS FROM COMPETITIVE EXAMS
33 Videos
- PROBABILITYBOOK - NEW JOYTHI PUBLICATIONCHAPTER - PROBABILITYEXERCISE - QUESTIONS FROM COMPETITIVE EXAMS
20 Videos
- SEQUENCES AND SERIES BOOK - NEW JOYTHI PUBLICATIONCHAPTER - SEQUENCES AND SERIES EXERCISE - QUESTIONS FROM COMPETITIVE EXAMS
105 Videos
Similar Questions
A={1,2,3,4},B={3,4,5} then (A×B)∩(B×A)=
View SolutionIf x≠1 and f(x)=x+1x−1 is a real function then fff (2) is
View SolutionIn a non-leap year the probability of getting 53 Sundays or 53 Tuesdays or 53 Thursdays is
View SolutionThe sum to n terms of the series 12+34+78+1516+....... is
View SolutionHow many lines of symmetry does the above figure have ?
View SolutionDetermine the point of symmetry of a regular hexagon.
View SolutionDtermine the images of the following figure about the given line :
View SolutionMatch the following Column A to Column B

View SolutionMatch the following Column A to Column B

View SolutionMatch the following Column A to Column B

View SolutionFind the area of figure given below.

View SolutionFind the perimeter of the figure given below.

View SolutionFind the area of the figure given below.

View SolutionThe area of the shaded part in the figure given below is ______.

View SolutionThe inequation represented by the graph given below is :
View SolutionThe inequation that best describes the graph given below is _________
View Solution
