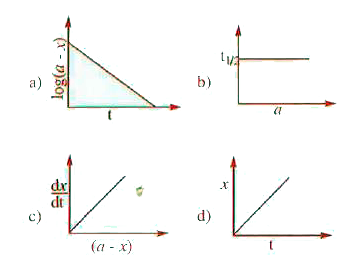
For Zero Order Reaction, Plot of Concentration of Reactant v/s time is a straight line graph with
Negative slope
positive slope
parabolic curve
Hyperbolic curve
The correct Answer is:A
समान प्रश्न
Plot a graph of concentration of a reactant at time t, [ (a-x)] against time for a first order reaction .Here a = initial concentration of the reactant an x = change in concentration of the reactant at any time 1 during the reaction.
View Solutionplot a graph of reaction -rate vs concentration of the reactant for a fist order reaction.
View SolutionWhich of the following graphs represent a first order reaction (a=initial concentration of reactant, x=concentration of reactant consumed, t=time)

View SolutionPlot a graph showing variation in the concentration of reactants against time for a zero order reaction.
View SolutionFor a given reaction the logarithm of the concentration of the reactant plotted against time gave a straight line with negative slope . The order of the reaction is
View SolutionA plot of reactant concentration versus time for a reaction is a straight line with a negative slope giving the rate constant, and the intercept, giving the initial concentration of the reactant. The order of the reaction is
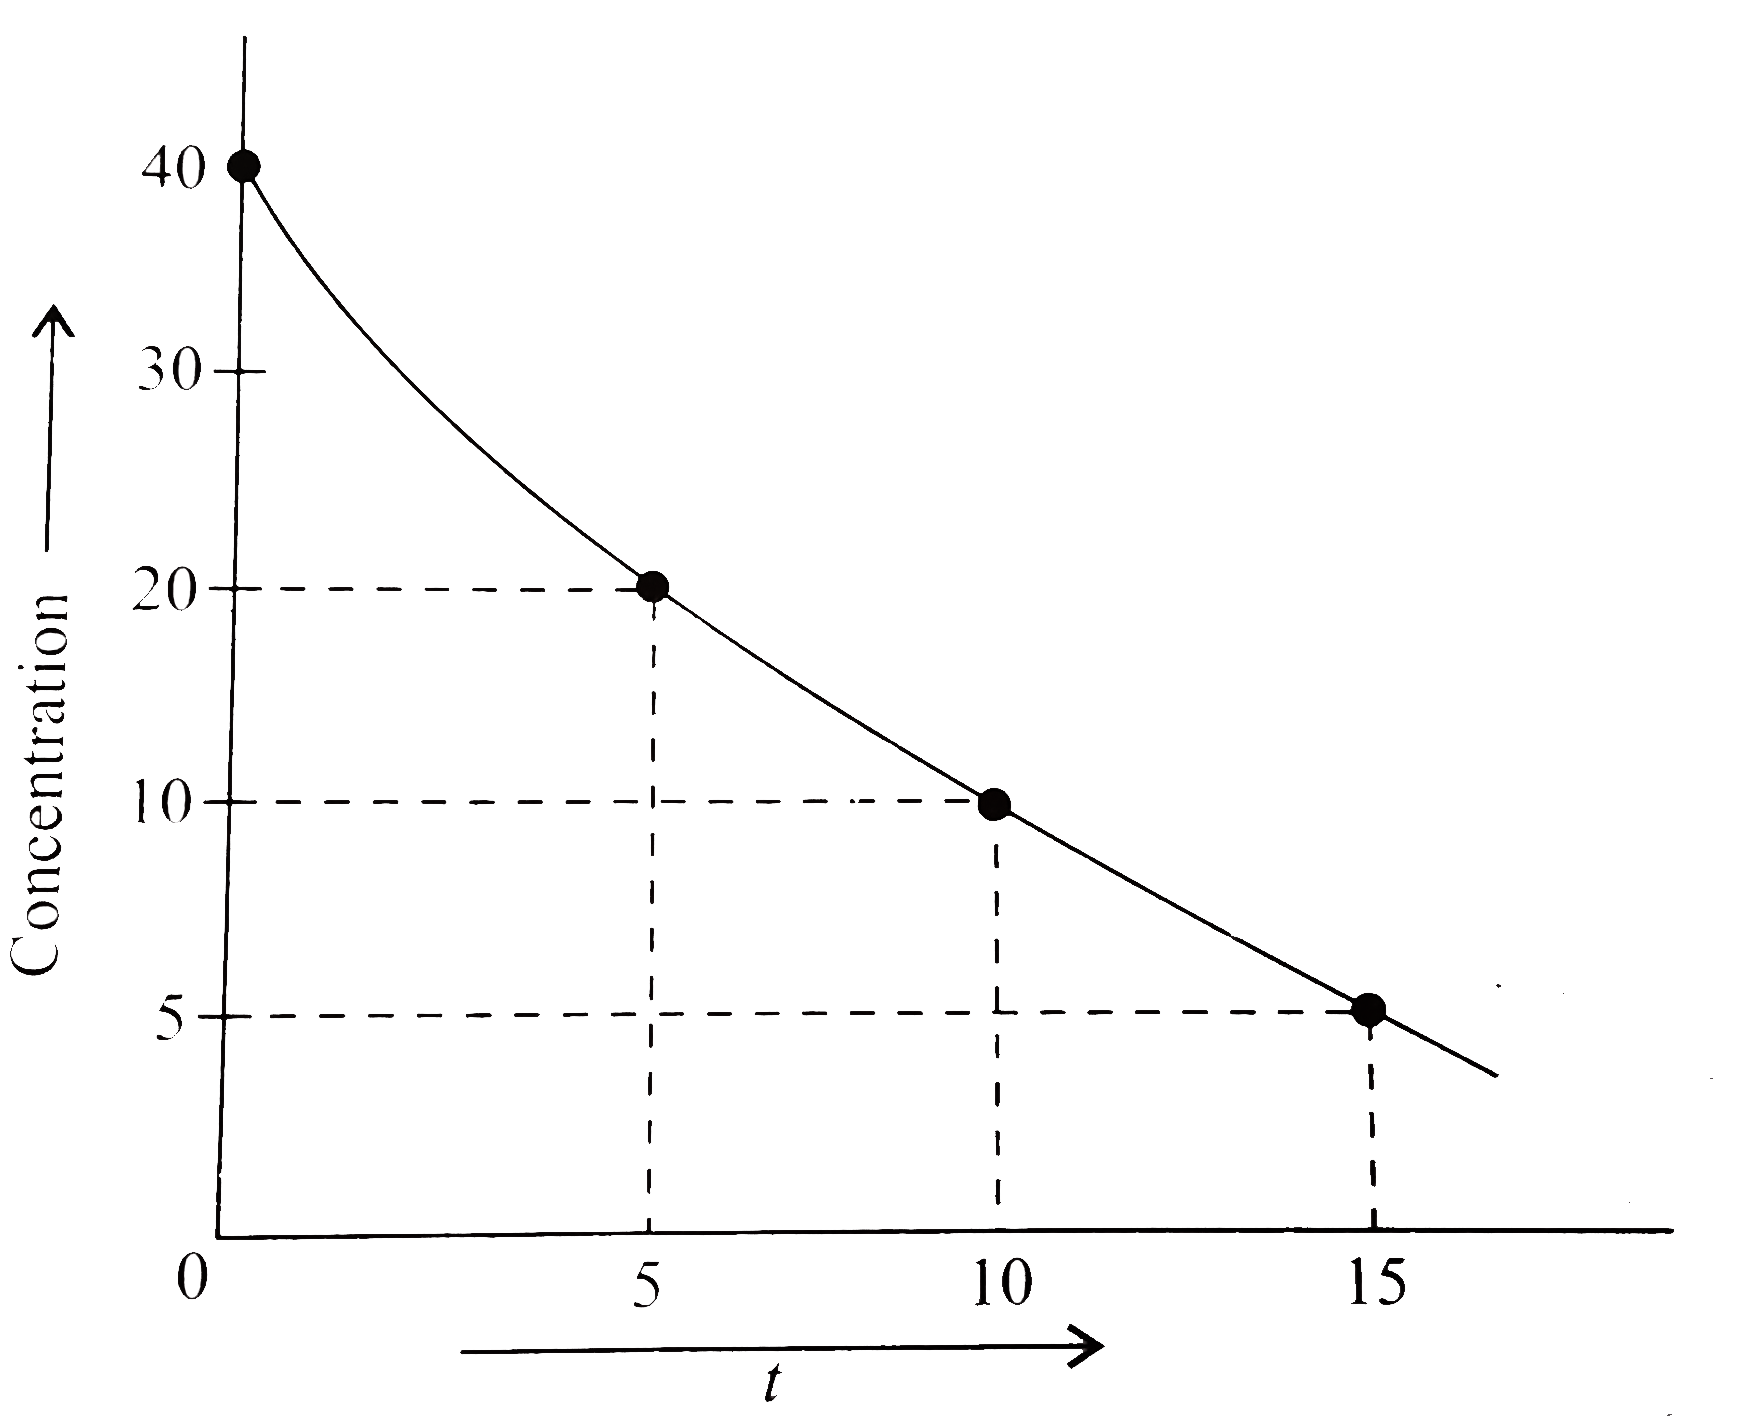
View SolutionFor a reaction , a graph was plotted between reactant concentration c and time as shown in the figure below.

Identify the order of the reaction with respect to the reactant. Can the concentration of the reactant be theoretically zero after infinite time?
View Solution
