Graphically represent the variatin of resistivity of carbon with temperture
To graphically represent the variation of resistivity of carbon with temperature, we can follow these steps:
1. Understand the Relationship: Recognize that the resistivity of carbon decreases as the temperature increases. This is a characteristic behavior of semiconductors and certain materials like carbon.
2. Set Up the Axes: Draw a Cartesian coordinate system. Label the vertical axis as "Resistivity (ρ)" and the horizontal axis as "Temperature (T)".
3. Choose the Scale: Decide on an appropriate scale for both axes. For resistivity, you might use units like ohm-meters (Ω·m), and for temperature, you can use degrees Celsius (°C) or Kelvin (K).
4. Plot the Points: While we may not have exact numerical values, we can qualitatively plot points based on the understanding that as temperature increases, resistivity decreases. Start with a higher resistivity value at lower temperatures and gradually decrease it as you move to higher temperatures.
5. Draw the Curve: Connect the plotted points with a smooth curve. The curve should slope downwards from left to right, indicating the decrease in resistivity with an increase in temperature. The shape of the curve can be approximately exponential, reflecting the nature of the decrease.
6. Label the Graph: Add a title to the graph, such as "Variation of Resistivity of Carbon with Temperature". You may also want to label the axes with their respective units.
Final Graph:
The final graph will show a downward-sloping curve starting from a higher resistivity value on the left (low temperature) and approaching lower resistivity values on the right (high temperature).
---
The final graph will show a downward-sloping curve starting from a higher resistivity value on the left (low temperature) and approaching lower resistivity values on the right (high temperature).
Topper's Solved these Questions
- SEMICONDUCTOR ELECTRONICS METERIALS DEVICES AND SIMPLE CIRCUITS BOOK - MODERN PUBLICATIONCHAPTER - SEMICONDUCTOR ELECTRONICS METERIALS DEVICES AND SIMPLE CIRCUITS EXERCISE - TOUGH & TRICKY PROBLEMS
10 Videos
- SEMICONDUCTOR ELECTRONICS METERIALS DEVICES AND SIMPLE CIRCUITS BOOK - MODERN PUBLICATIONCHAPTER - SEMICONDUCTOR ELECTRONICS METERIALS DEVICES AND SIMPLE CIRCUITS EXERCISE - NCERT FILE SOLVED (TEXT BOOK EXERCISES )
30 Videos
- SEMICONDUCTOR ELECTRONICS METERIALS DEVICES AND SIMPLE CIRCUITS BOOK - MODERN PUBLICATIONCHAPTER - SEMICONDUCTOR ELECTRONICS METERIALS DEVICES AND SIMPLE CIRCUITS EXERCISE - PRACTICE PROBLEMS
26 Videos
- RAY OPTICS AND OPTICAL INSTRUMENTSBOOK - MODERN PUBLICATIONCHAPTER - RAY OPTICS AND OPTICAL INSTRUMENTSEXERCISE - CHAPTER PRACTICE TEST
14 Videos
- WAVE OPTICALBOOK - MODERN PUBLICATIONCHAPTER - WAVE OPTICALEXERCISE - CHAPTER PRACTICE TEST
7 Videos
Similar Questions
Graphically represent the variation of electric potential and electric field due to point charge with respect to the distance from the point charge.
View SolutionWhat is Ohm's law ? How is it represented graphically ? Derive an expression for the resultant resistance of a series combination of resistors.
View Solution
Knowledge Check
Which one of the following graphs represents the variation of surface tension of water with temperture for a small range of temperature ?
A B
B C
C D
D
A constant potential difference is applied across a resistance. Consider variation of resistance with temperature. Which graph represents best the variation of power produced in resistance versus resistance?
A B
B C
C D
D
The resistance of carbon _______ with rise in the temperature.
AincreasesBdecreasesCremains the sameDfirst increases then decreases
the rate law of the reaction A→ Product is : rate = k[A]. It has been graphically represented. What is the rate constant for the reaction?

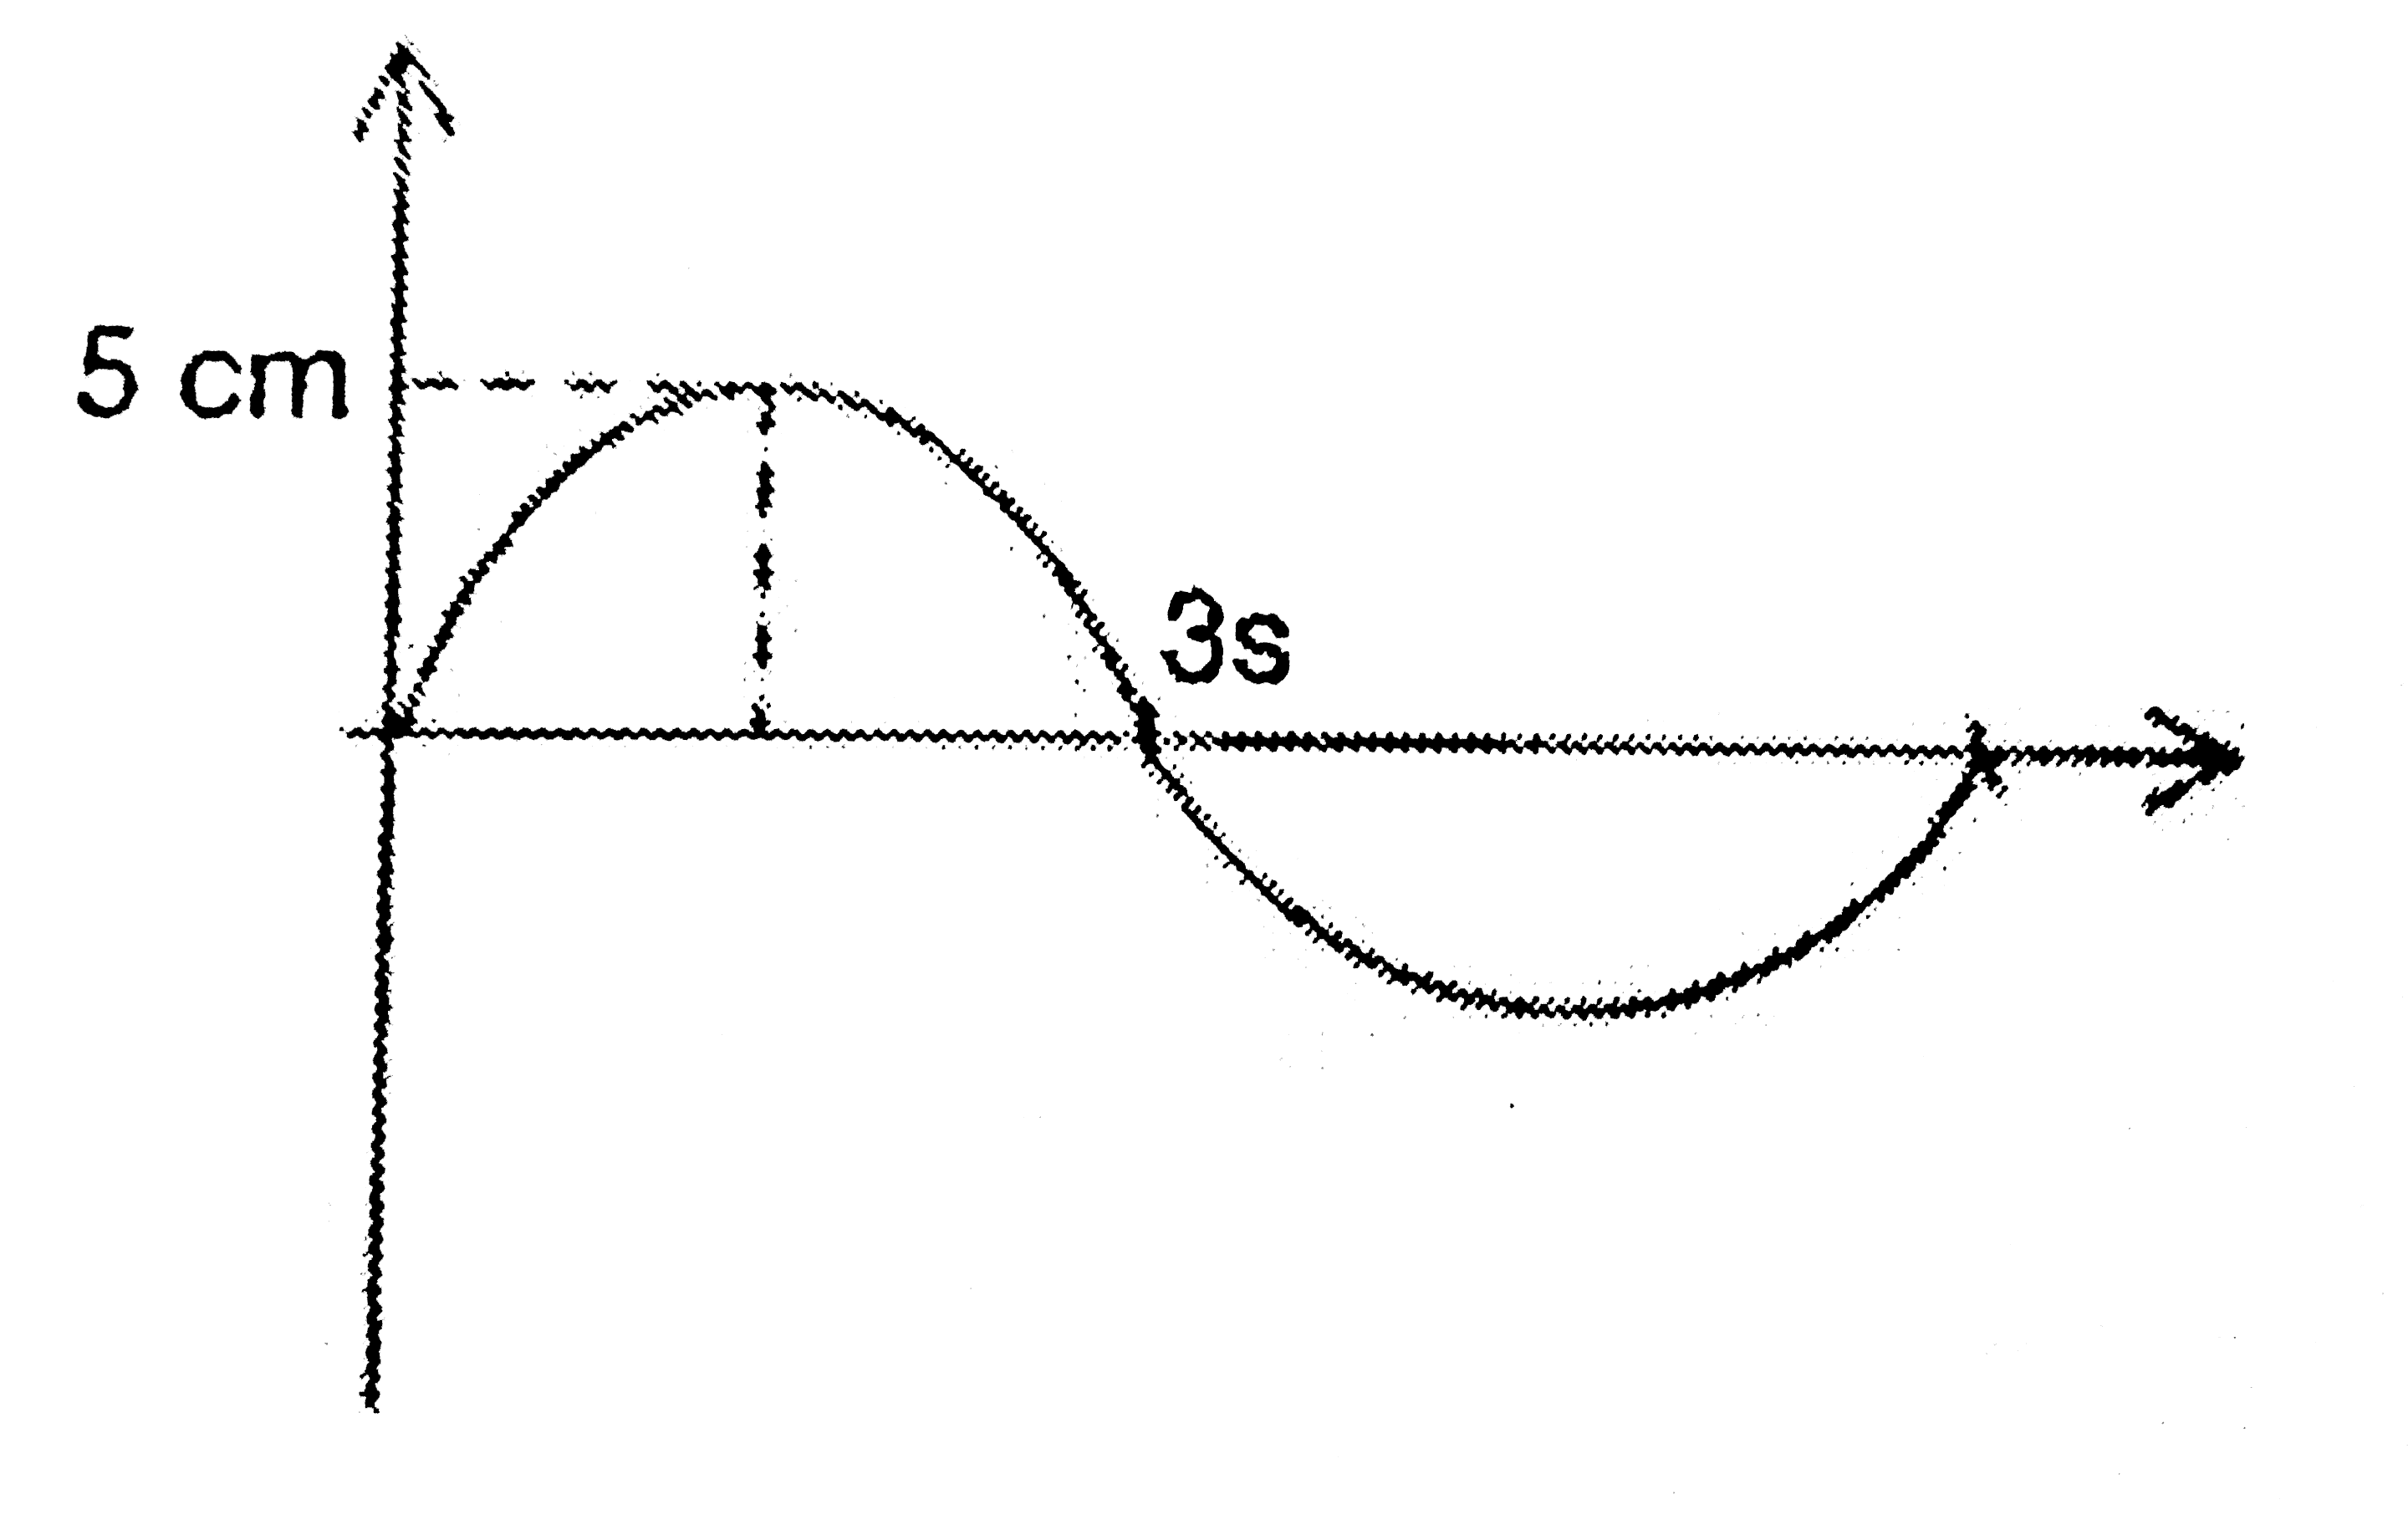
View SolutionThe oscillation of a simple pendulum is graphically represented as follows. Determine the
(a) time period (b) frequency (c) amplitude

View SolutionAbsolute zero is defined as the temperture
View SolutionCopper and carbon wires are connected in series and the combined resistor is kept at 0∘C. Assuming the combined resistance does not vary with temperature the ratio of the resistances of carbon and copper wires at 0∘C is (Temperature coefficient of resistivity of copper and carbon respectively are 4×10⁻³^(∘)C) and −0.5×10⁻³^(∘)C)
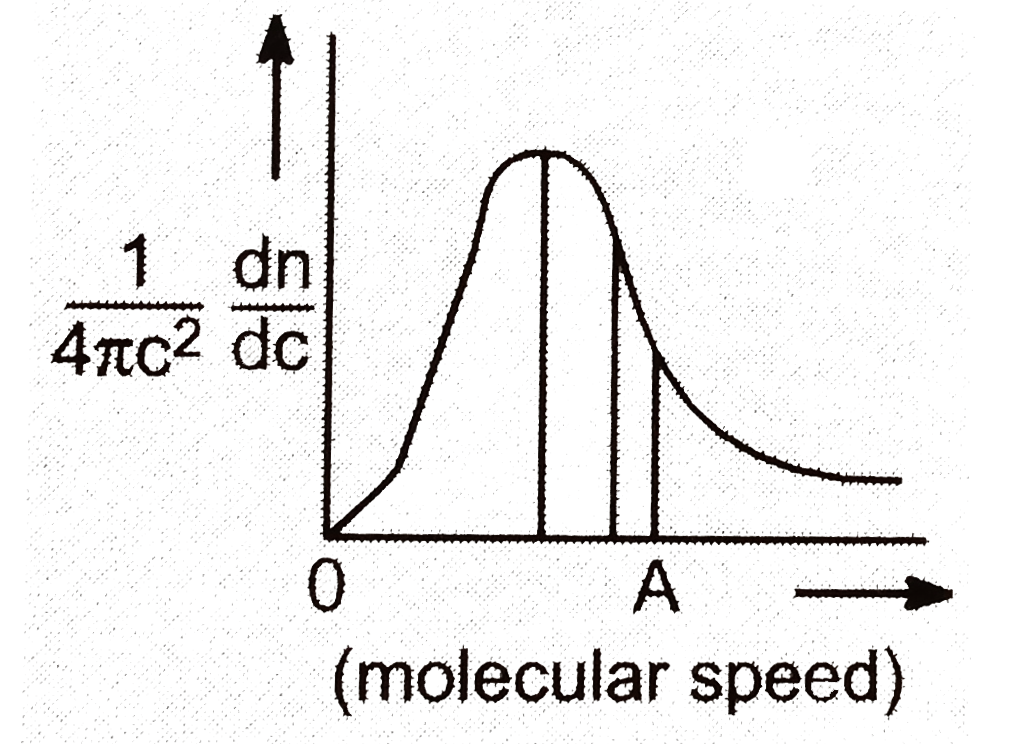
View SolutionThe Maxwell-Boltzmann distribution law of molecular speeds is graphically represented as
 The curve has which of the following characteristics ?.
View Solution
