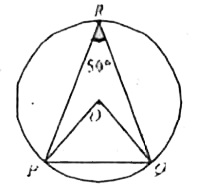
चित्र में O वृत्त का केंद्र है एव PQ एक जीवा है। यदि ∠PRQ=50∘ हो, तो ∠OPQ का मान ज्ञात कीजिए।

Step by step video & image solution for चित्र में O वृत्त का केंद्र है एव PQ एक जीवा है। यदि anglePRQ =50 ^(@) हो, तो angleOPQ का मान ज्ञात कीजिए। by Maths experts to help you in doubts & scoring excellent marks in Class 10 exams.
Updated on:21/07/2023Topper's Solved these Questions
- छत्तीसग़ढ हाई स्कूल बोर्ड परीक्षा ,2018BOOK - CHATTISGARH BOARD PREVIOUS YEARCHAPTER - छत्तीसग़ढ हाई स्कूल बोर्ड परीक्षा ,2018EXERCISE - गणित (खण्ड-स)
27 Videos
- छत्तीसग़ढ हाई स्कूल बोर्ड परीक्षा ,2018BOOK - CHATTISGARH BOARD PREVIOUS YEARCHAPTER - छत्तीसग़ढ हाई स्कूल बोर्ड परीक्षा ,2018EXERCISE - विज्ञान (खण्ड-अ)
1 Videos
- छत्तीसग़ढ हाई स्कूल बोर्ड परीक्षा ,2018BOOK - CHATTISGARH BOARD PREVIOUS YEARCHAPTER - छत्तीसग़ढ हाई स्कूल बोर्ड परीक्षा ,2018EXERCISE - गणित (खण्ड-ब)
9 Videos
- छत्तीसगढ़ हाईस्कूल बोर्ड परीक्षा, 2017 BOOK - CHATTISGARH BOARD PREVIOUS YEARCHAPTER - छत्तीसगढ़ हाईस्कूल बोर्ड परीक्षा, 2017 EXERCISE - गणित SET - C
37 Videos
- छत्तीसग़ढ हाई स्कूल बोर्ड परीक्षा ,2019BOOK - CHATTISGARH BOARD PREVIOUS YEARCHAPTER - छत्तीसग़ढ हाई स्कूल बोर्ड परीक्षा ,2019EXERCISE - गणित खंड-C (रिक्त स्थानों की पूर्ति कीजिए:)
6 Videos
Similar Questions
एक विषम संख्या और एक सम संख्या का योग सदैव सम संख्या होता है।
View Solutionद्विघात समीकरण के मूल होते है :
View Solutionयदि समान्तर श्रेणी का । nवाँ पद (2n-1) है, तो श्रेणी का तीसरा ……………….. पद होगा।
View Solution60∘ को रेडियन में परिवर्तित कीजिए |
View Solution2 तथा 6 का मध्यानुपात .......... होगी|
View SolutionHow many lines of symmetry does the above figure have ?
View SolutionWhich of the following are correct chain isomers of butane ? (i)
View SolutionDetermine the point of symmetry of a regular hexagon.
View SolutionDtermine the images of the following figure about the given line :
View SolutionMatch the following Column A to Column B

View SolutionMatch the following Column A to Column B

View SolutionMatch the following Column A to Column B

View SolutionThe inequation represented by the graph given below is :
View SolutionThe inequation that best describes the graph given below is _________
View SolutionThe inequation that best describes the following graph is _________
View SolutionWhich inequations represent the shaded region in the given figure
View Solution
