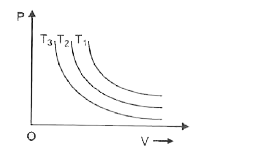
The isothermal diagram of a gas at three different temperatures T1,T2andT3, is shown in the given figure. Then
T1<T2<T3
T1<T2>T3
T1>T2>T3
T1>T2<T3
The correct Answer is:C
The given diagram shows that the curves move away from the origin at higher temperature.
Correct choise is (c ).
Topper's Solved these Questions
- HEAT AND THERMODYNAMICSBook:MODERN PUBLICATIONChapter:HEAT AND THERMODYNAMICSExercise:Multiple Choice Questions (Level - III) (Questions From AIEEE/JEE Examination)
Explore 17 Videos
- HEAT AND THERMODYNAMICSBook:MODERN PUBLICATIONChapter:HEAT AND THERMODYNAMICSExercise:Recent Competitve Questions
Explore 17 Videos
- HEAT AND THERMODYNAMICSBook:MODERN PUBLICATIONChapter:HEAT AND THERMODYNAMICSExercise:Recent Competitve Questions
Explore 17 Videos
- GRAVITATIONBook:MODERN PUBLICATIONChapter:GRAVITATIONExercise:Recent Competitive Questions
Explore 8 Videos
- LAWS OF MOTIONBook:MODERN PUBLICATIONChapter:LAWS OF MOTIONExercise:Revision test
Explore 43 Videos
Similar Questions
The current - voltage graphs for a given metallic wire at two different temperatures T1andT2 are shown in the figure.
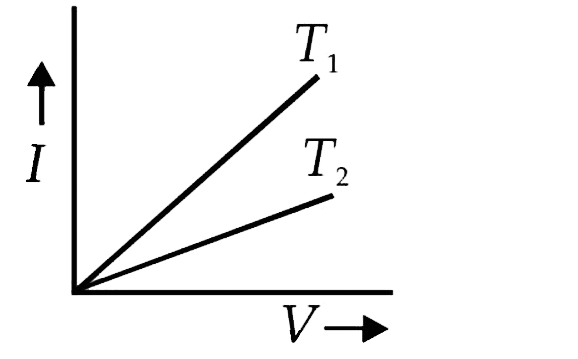
The temperature T2 is greater than T1.
View SolutionThe current - voltage graphs for a given metallic wire at two different temperatures T1andT2 are shown in the figure.

The temperature T2 is greater than T1.
View Solution
Knowledge Check
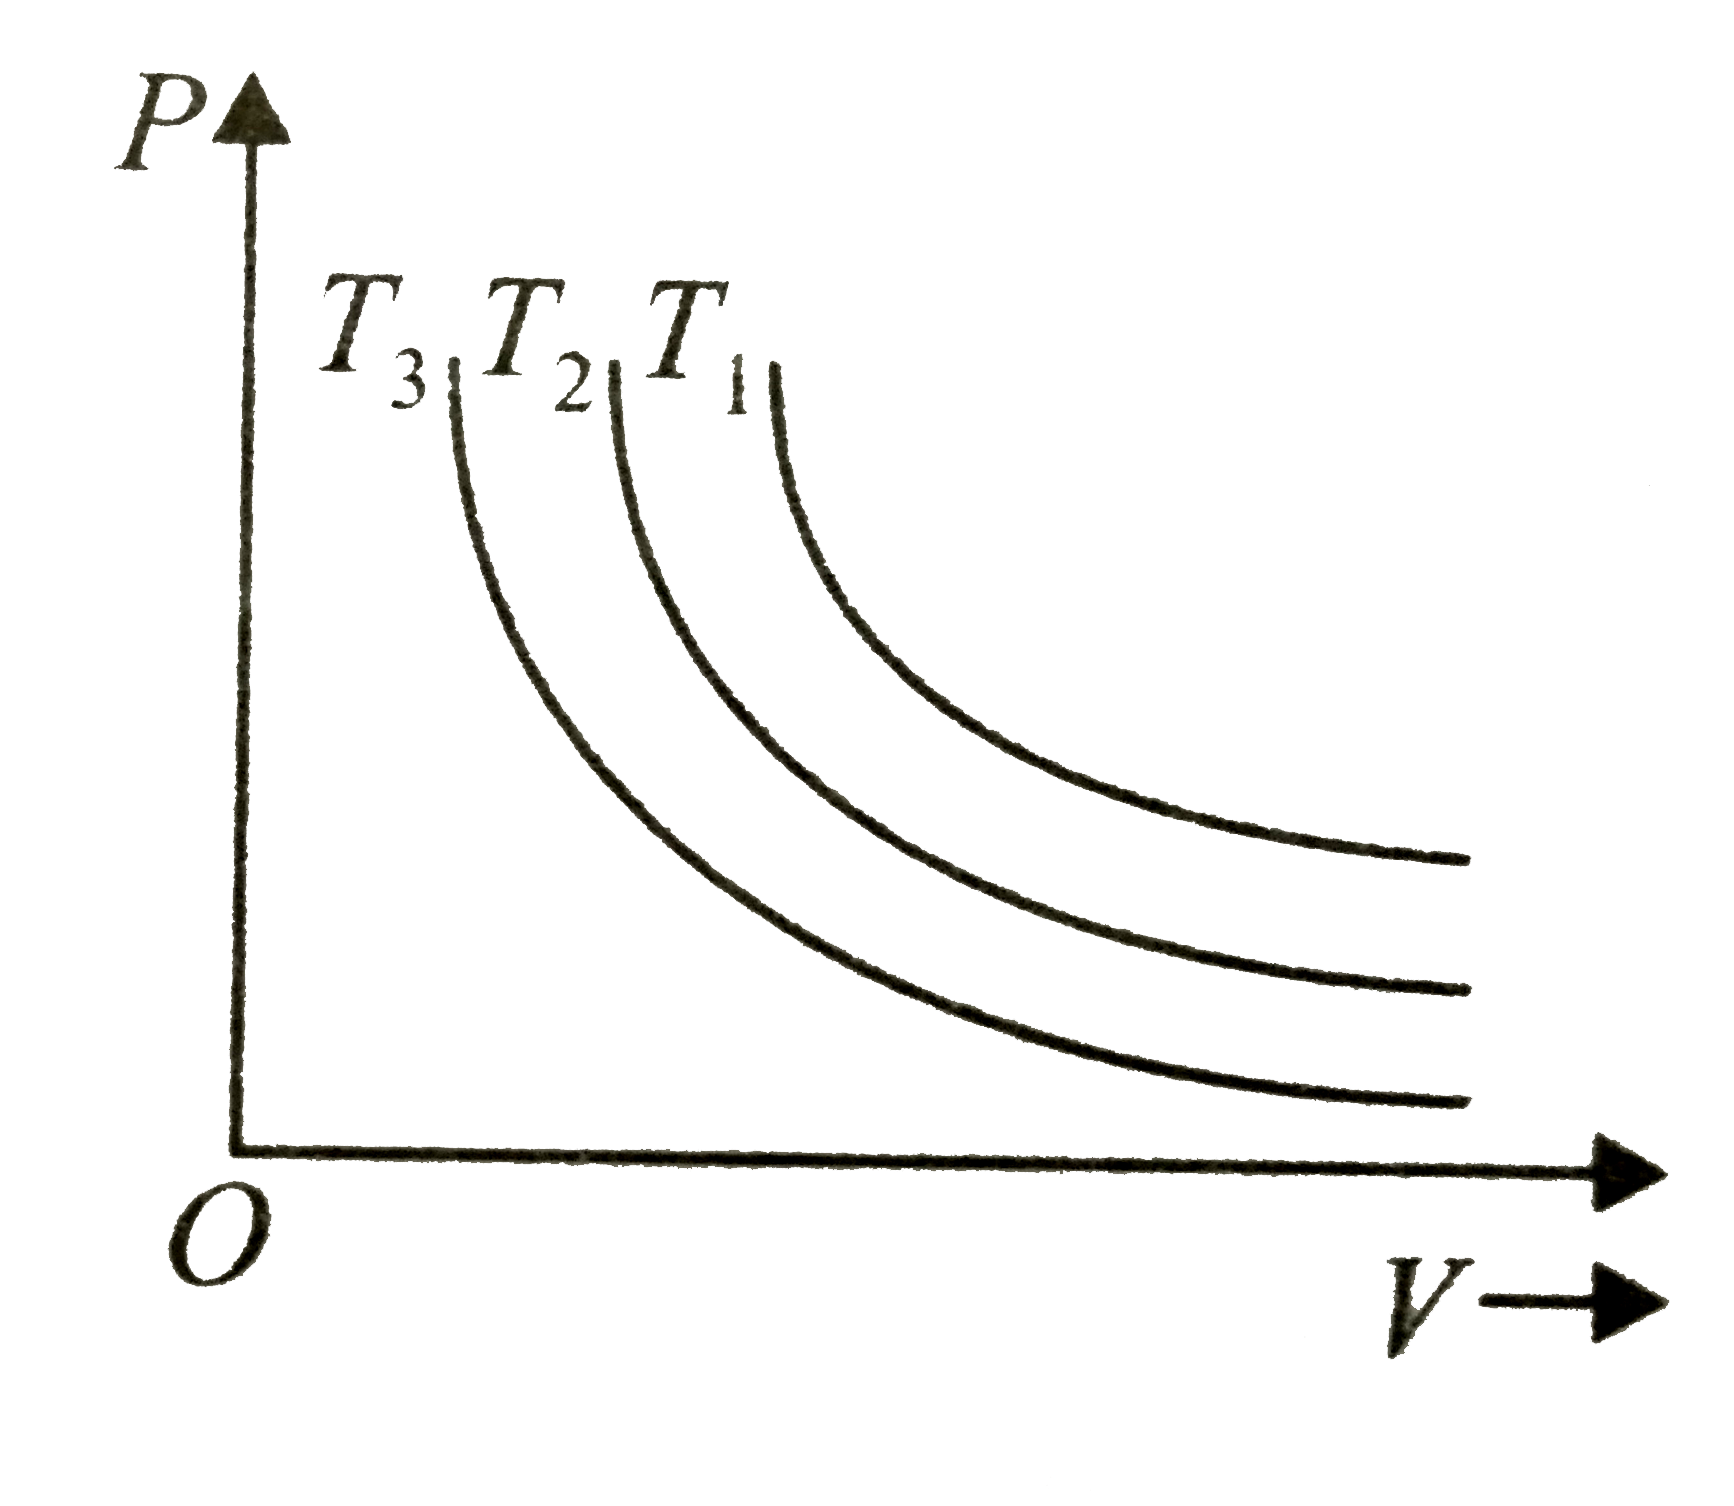
The isothermal diagram of a gas at three different temperatures T1,T2andT3, is show in the given figure .Then
 Aa.T1<T2<TBb. T1<T2>T3Cc.T1>T2>T3Dd.T1>T2<T3
The isothermal diagram of a gas at three different temperatures T1,T2and_(3), is show in the given figure .Then
 AT1<T2<T3BT1<T2>T3CT1>T2>T3DT1>T2<T3
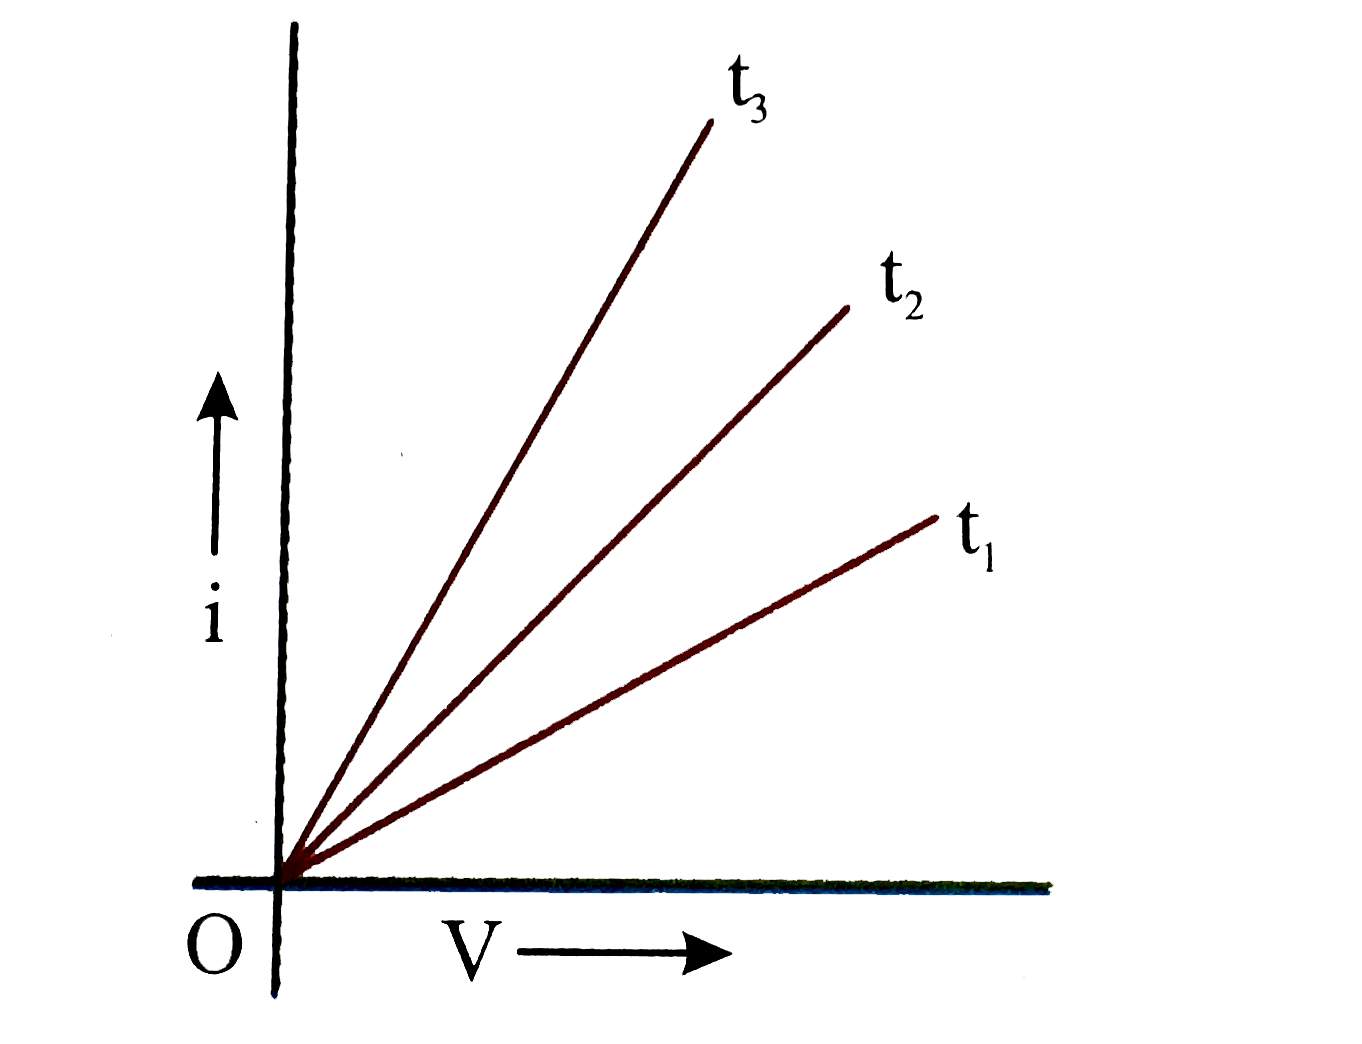
V−i graphs of anichrome wire at three different temeperatures t1, t2 and t3 are shown. From the graph.
 At1<t2<t3Bt1>t2>t3Ct1<t2>t3Dt1>t2<t3
The current - voltage graphs for a given metallic wire at two different temperatures T1andT2 are shown in the figure.

The temperature T2 is greater than T1.
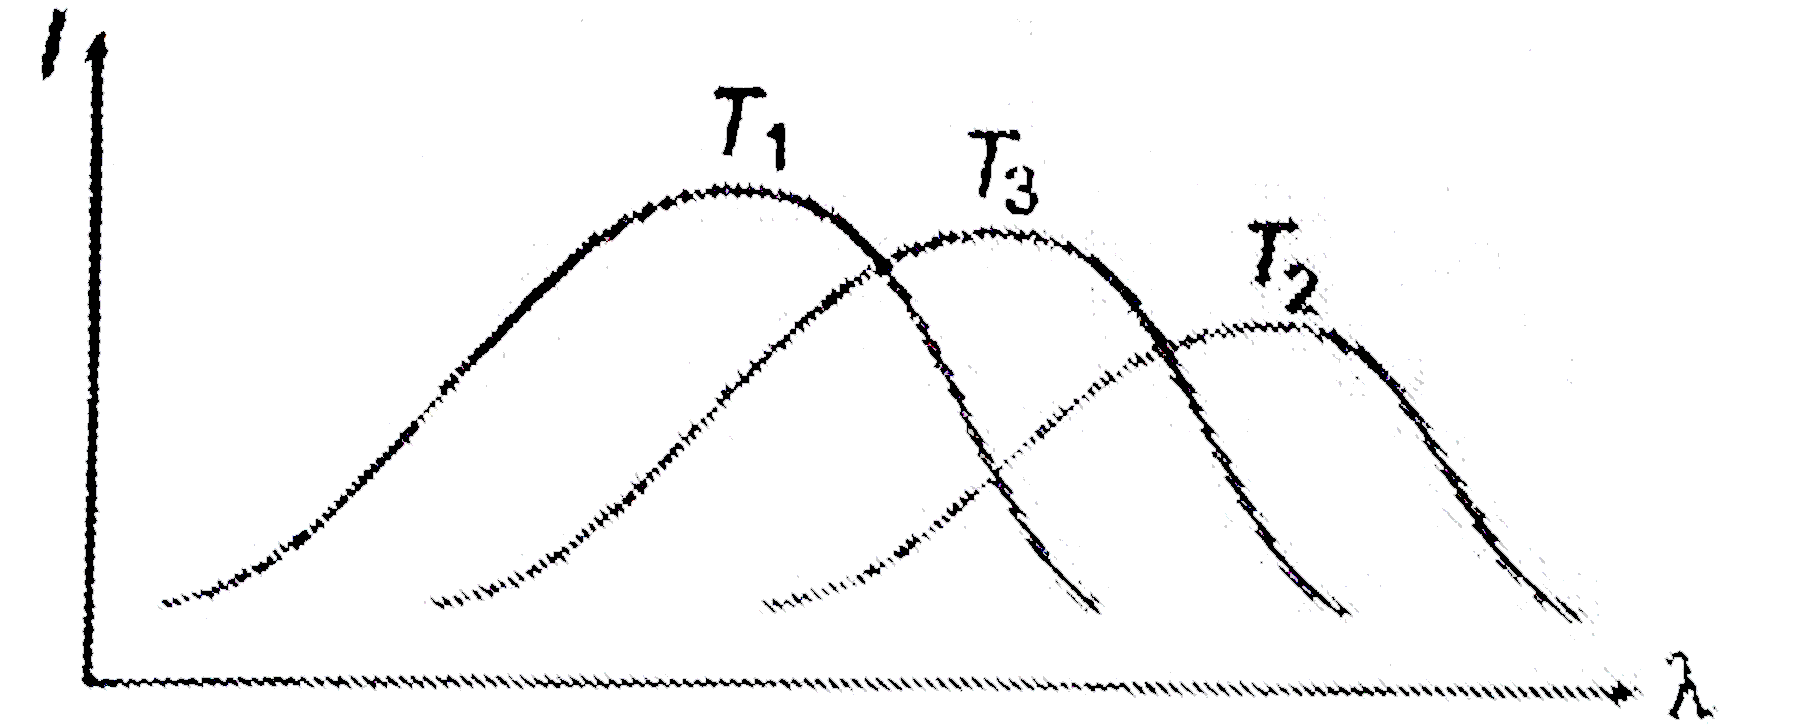
View SolutionThe plots of intensity of radiation versus wavelength of 3 black bodies of temperatures T1,T2 and T3 as shown in the figure, then
View SolutionThe voltage V and current I graph for a conductor at two different temperatures T1 and T2 are shown in the figure. The relation between T1 and T2 is
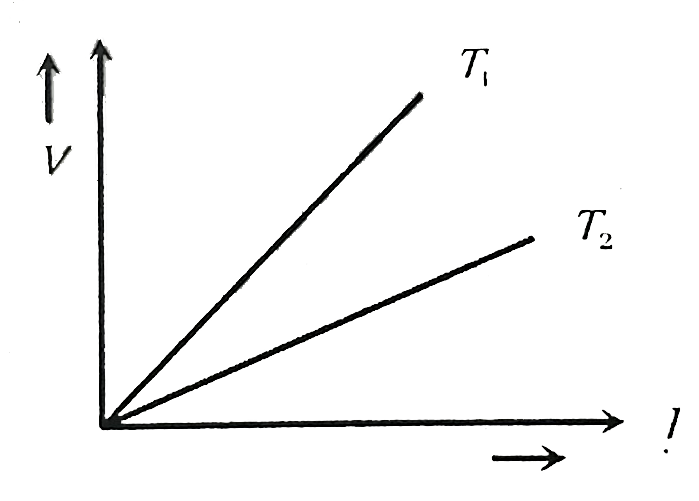
View SolutionThe voltage V and current I v graphs for a conductor at two different temperatures T1andT2 are shown in the figure. The relation between T1andT2 is

View SolutionThe voltage V and current I v graphs for a conductor at two different temperatures T1andT2 are shown in the figure. The relation between T1andT2 is

View Solution
