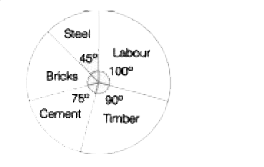
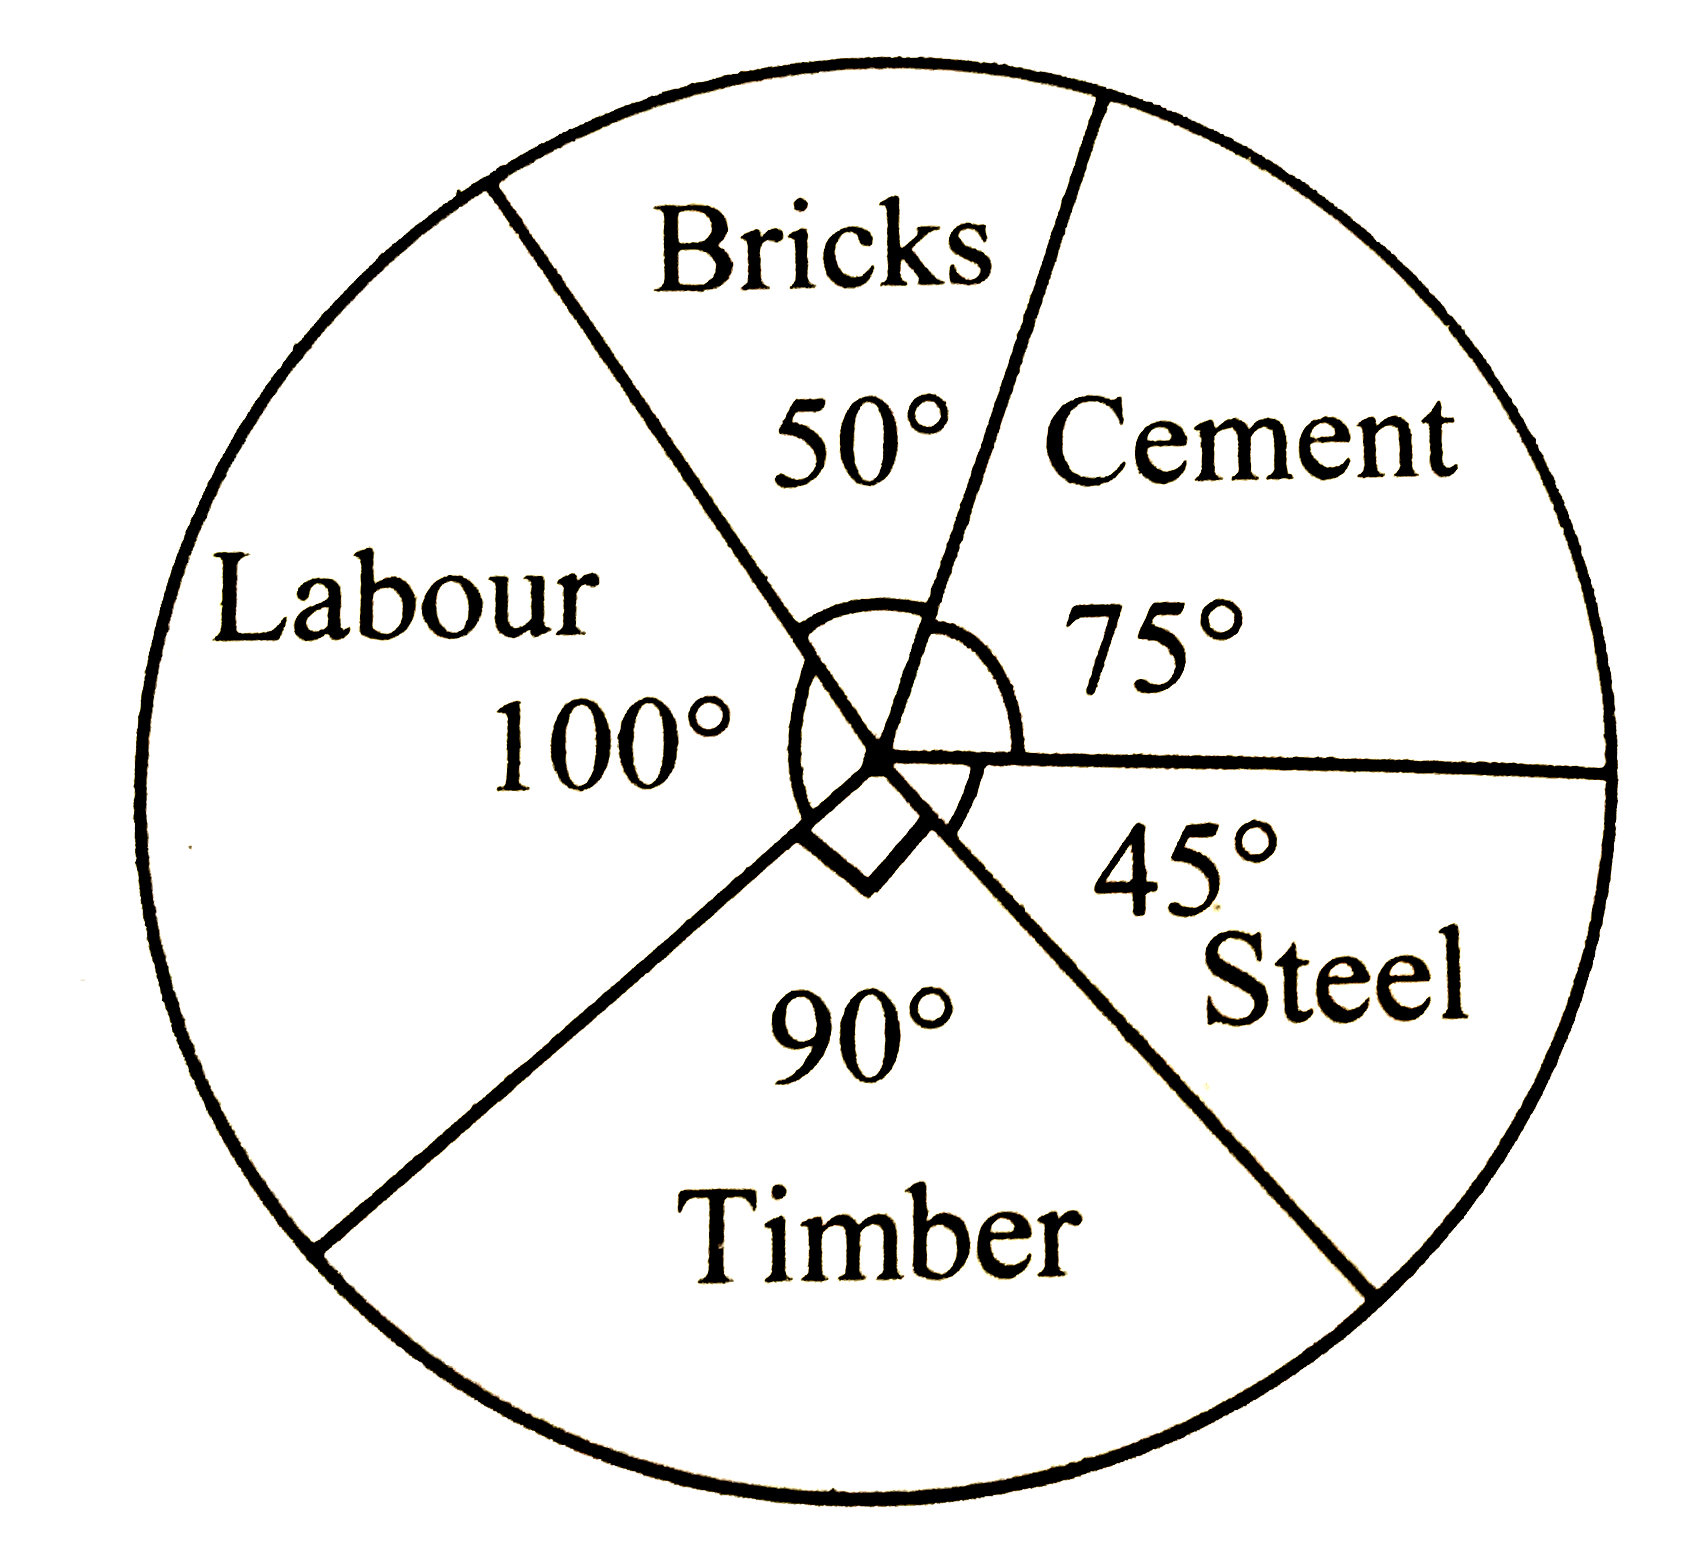
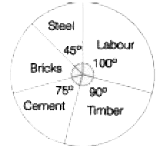
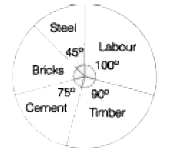
The following pie chart represents a total expenditure of 540000 on different items in constructing a flat in a town. The expenditure (in ?) on bricks is
75000
67500
150000
70000
Step by step video, text & image solution for The following pie chart represents a total expenditure of 540000 on different items in constructing a flat in a town. The expenditure (in ?) on bricks is by Maths experts to help you in doubts & scoring excellent marks in Class 14 exams.
Topper's Solved these Questions
- BOOK - ARIHANT SSCCHAPTER - PIE CHART EXERCISE - Exercise Higher Skill Level Questions15videos
PIE CHART
- BOOK - ARIHANT SSCCHAPTER - PIE CHART EXERCISE - Exercise Higher Skill Level Questions15videos
PIE CHART
- BOOK - ARIHANT SSCCHAPTER - PERMUTATIONS AND COMBINATIONSEXERCISE - HIGHER SKILL LEVEL QUESTIONS19videos
PERMUTATIONS AND COMBINATIONS
- BOOK - ARIHANT SSCCHAPTER - PIPES AND CISTERNS EXERCISE - EXERCISE HIGHER SKILL LEVEL QUESTION17videos
PIPES AND CISTERNS
Similar Questions
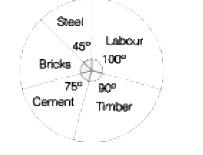
The following pie chart represents a total expenditure of 540000 on different items in constructing a flat in a town. Which is the item of maximum expenditure?
 View Solution
The adjacent pie diagram represents expenditure on different items in constructing a building. If the expenditure on bricks is Rs75000, find the total expenditure and expenditure on labour.
 View Solution
Knowledge Check
- Question 1 - Select One
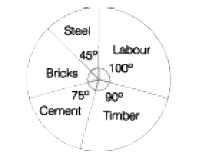
The following pie chart represents a total expenditure of 540000 on different items in constructing a flat in a town. The expenditure on bricks is less than the expenditure on timber (in ?)
 A10000B12500C60000D65000
 - Question 2 - Select One or More
The following pie chart represents a total expenditure of 540000 on different items in constructing a flat in a town. The expenditure (inT)on cement is
 A75000B90000C135000D112500
 - Question 3 - Select One or More
The following pie chart represents a total expenditure of 540000 on different items in constructing a flat in a town. The percentage of the total expenditure spent on steel and cement is
 A0.3323B0.25C3313%D30%
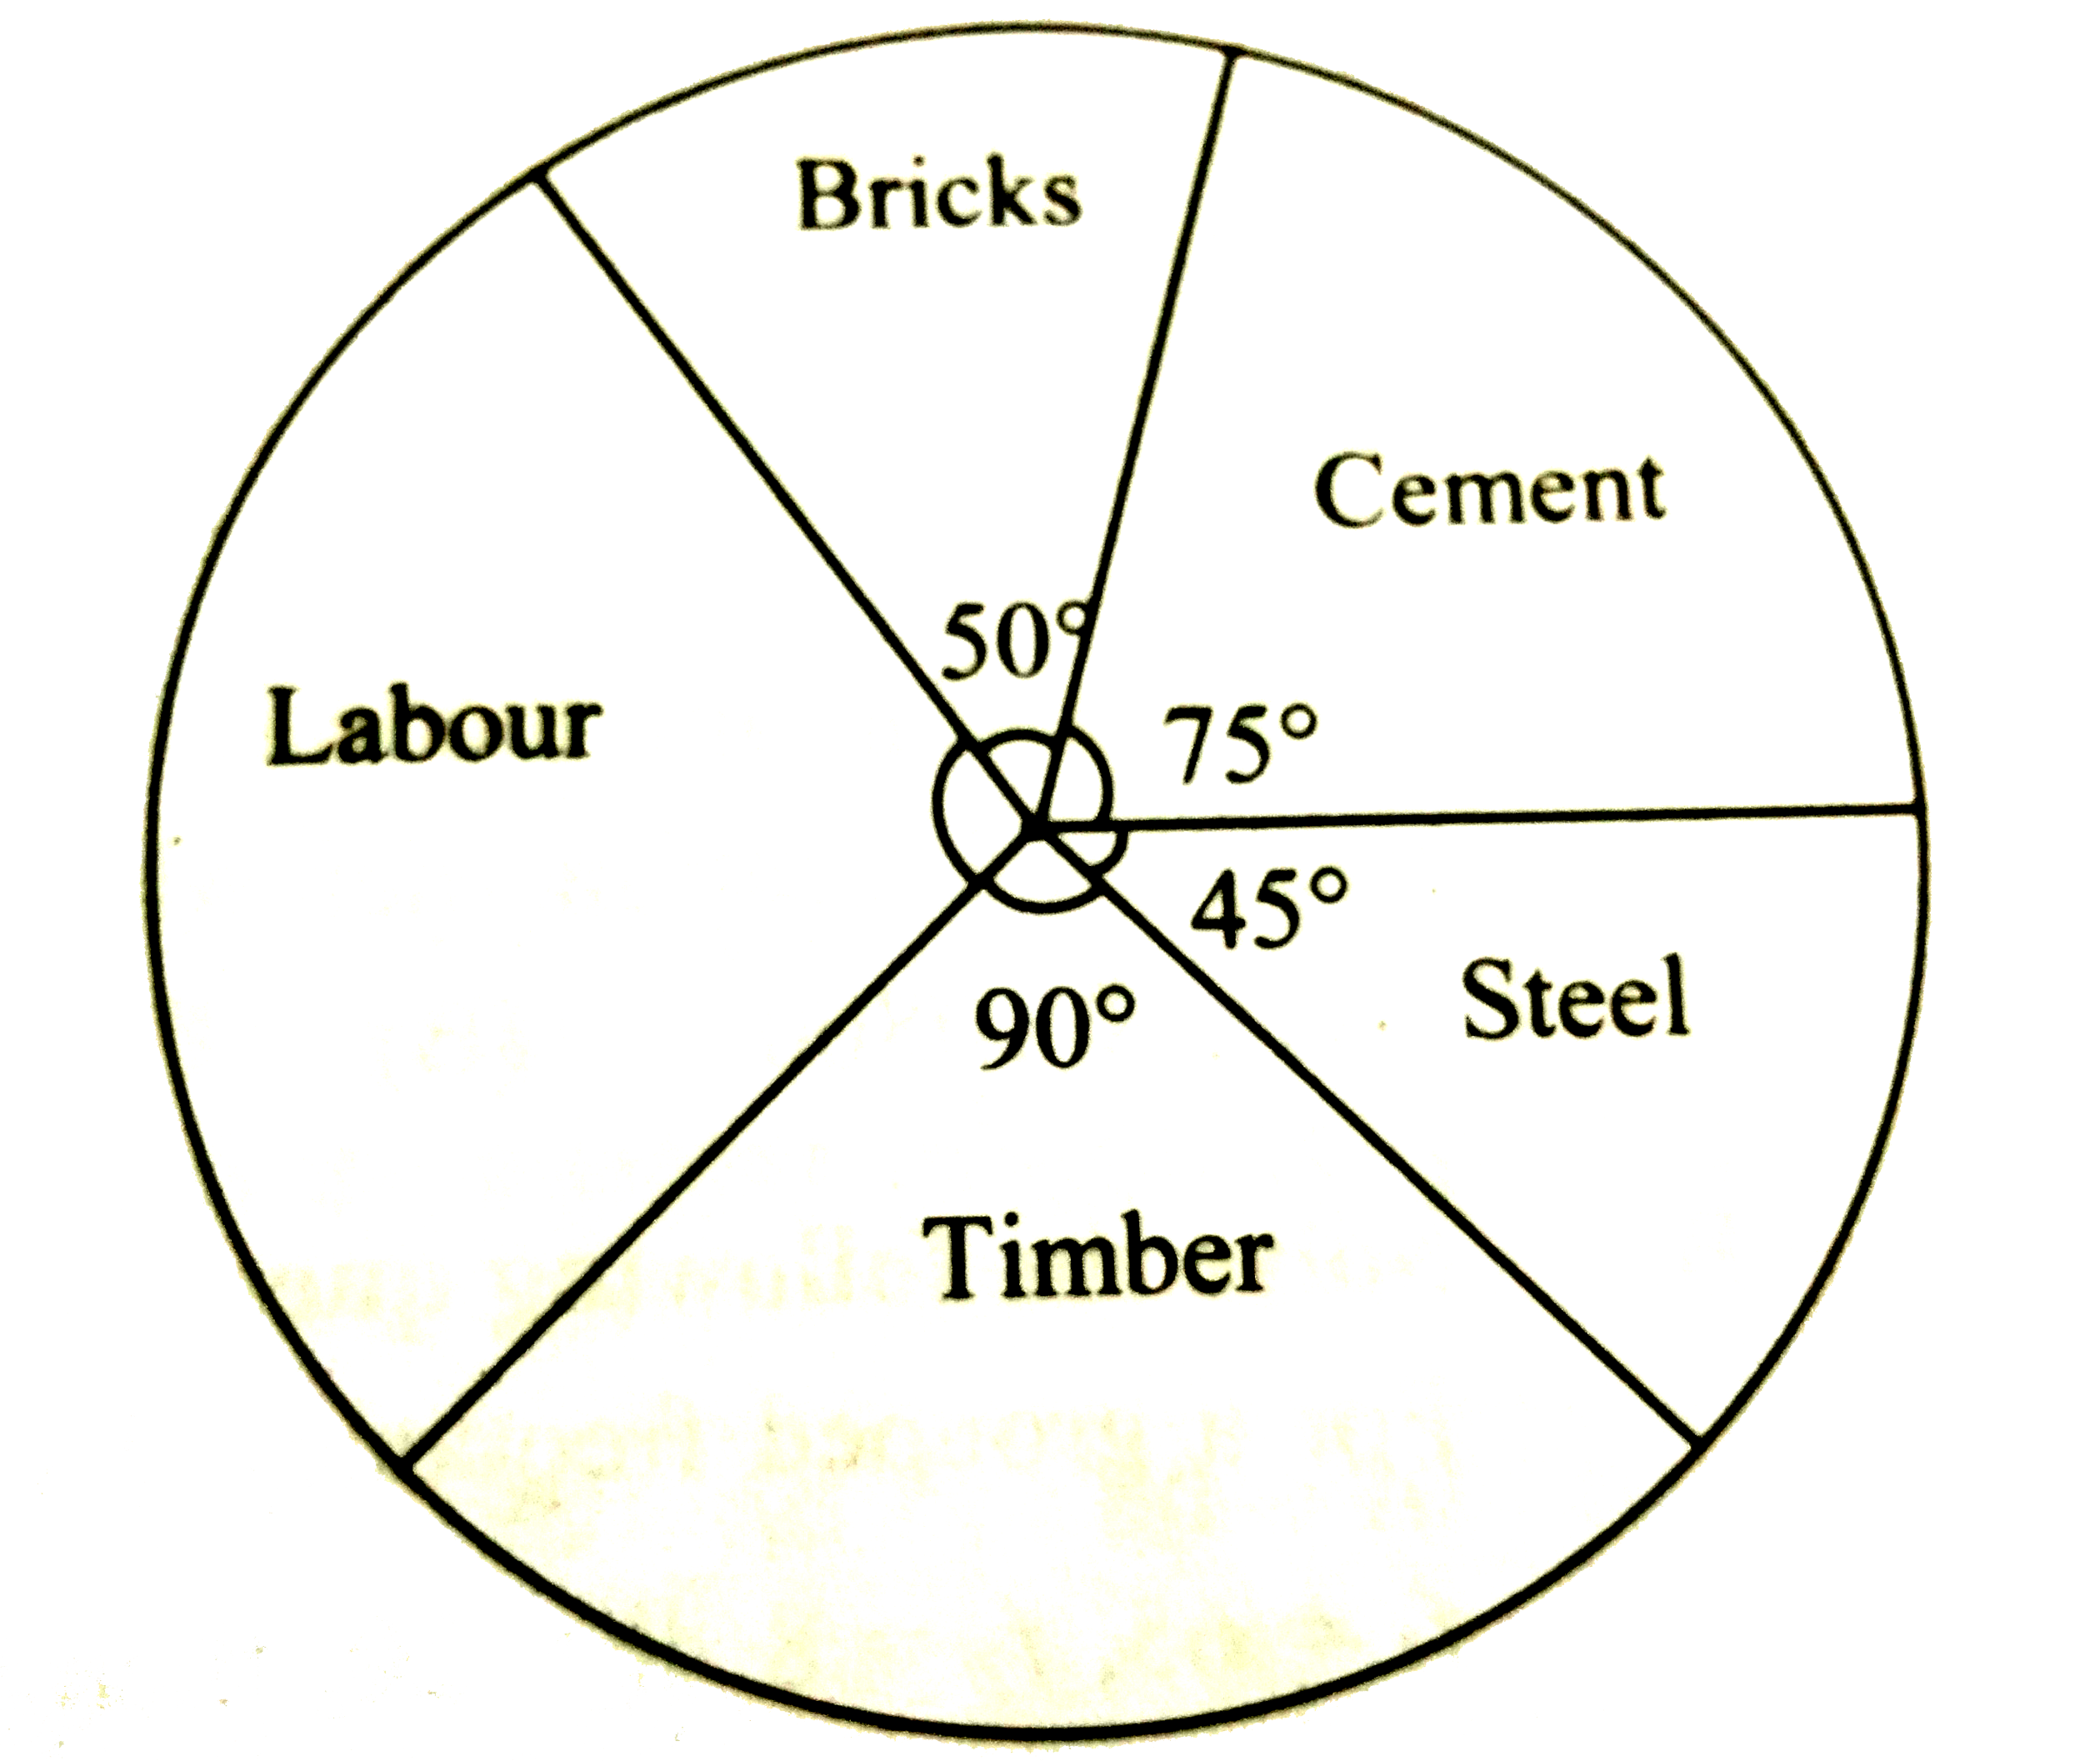
The following pie diagram represents expenditure on different items in constructing a building.
If the total construction cost of building is Rs540000 answer the following questions:
i. Find the central angle for labour expenditure.
ii. Find the expenditure on labour.
 View Solution
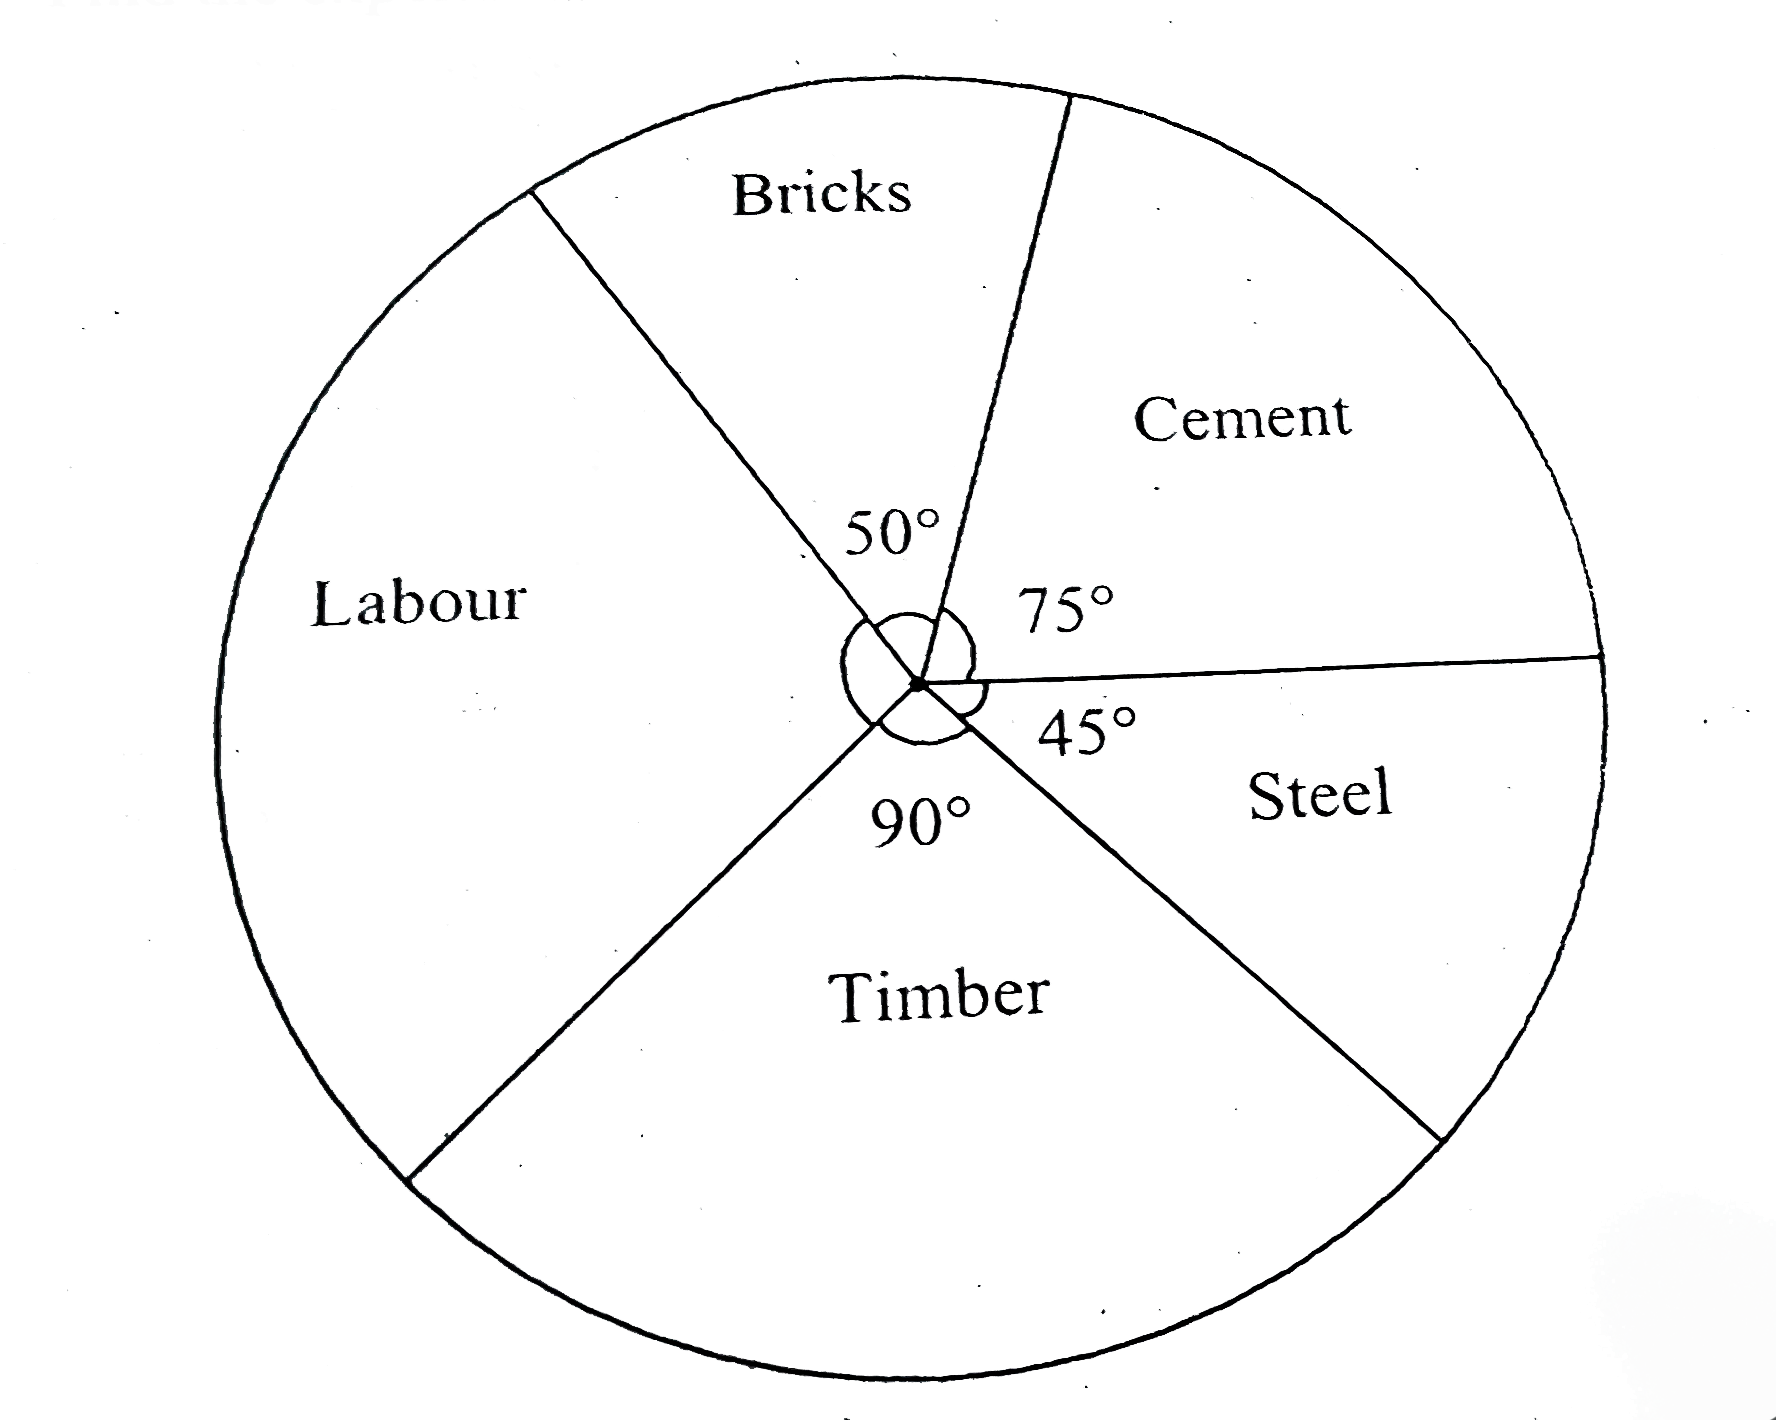
The following pie diagram represents expenditure on different items in constructing a building. If the total construction cost of building is Rs. 5,40,000, answer the following questions:
a. Find the central angle for labour expenditure.
b. Find the expenditure on labour.
 View Solution
In the given pie chart what is the total expenditure on rent
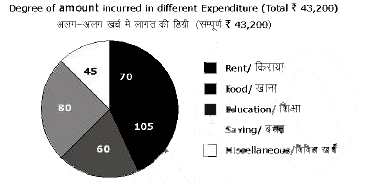 View Solution
The following pie chart depicts the expenditure of a state government under different heads,
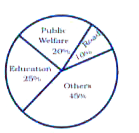
What fraction of the total expenditure is spent on both roads and public welfare together?View SolutionThe following data shows the expenditure of a person on different items during a month. Represent the data by a pie-chart. Items of expenditure, Rent, Education, Food, Clothing, Others Amount (in Rs.), 2700, 1800, 2400, 1500, 2400
View Solution

