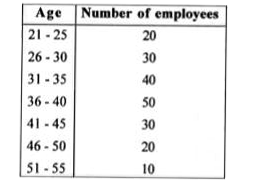
A public opinion polling agency surveyed 200 government empolyees . The following table shows the ages of the empolyees interviewed.

(i) Calculate the mean age of empolyees interviewed.
(ii) Compute the mean deviation of the ages about the mean age.Solution in Tamil
The correct Answer is:(i) =36.5
(ii) =6.65
Step by step video, text & image solution for A public opinion polling agency surveyed 200 government empolyees . The following table shows the ages of the empolyees interviewed. (i) Calculate the mean age of empolyees interviewed. (ii) Compute the mean deviation of the ages about the mean age. by Maths experts to help you in doubts & scoring excellent marks in Class 12 exams.
Topper's Solved these Questions
- BOOK - NEW JOYTHI PUBLICATIONCHAPTER - STATISTICSEXERCISE - EXSERCISE34videos
STATISTICS
- BOOK - NEW JOYTHI PUBLICATIONCHAPTER - STATISTICSEXERCISE - QUESTIONS FROM COMPETITIVE EXAMS40videos
STATISTICS
- BOOK - NEW JOYTHI PUBLICATIONCHAPTER - SETSEXERCISE - QUESTIONS FROM COMPETITIVE EXAMS21videos
SETS
- BOOK - NEW JOYTHI PUBLICATIONCHAPTER - STRAIGHT LINESEXERCISE - QUESTIONS FROM COMPETITIVE EXAMS122videos
STRAIGHT LINES
Similar Questions
The A . M first 'n' natural numbers is
09:36View SolutionThe mean mark in Statistics of 100 students in a class was 72 .The mean mark of boys was 75, while their number was 70. The mean mark of girls in the class was
07:56View SolutionIf A and B are not disjoint sets then n(A∪B) is equal to
06:07View SolutionThe incentre of the triangle ABC where A(-36, 7) B (20,7) and C (0,-8) is
02:11View SolutionThe following table shows age distribution of persons in a particular region.Find the: (i) mean age ( i) modal age (ii) median age Age?
01:31View SolutionAn opinion poll was conducted by interviewing 150 people. Calculate the mean age of the people on the basis of the following information about them. Use the short method.
02:45View SolutionWhich of the following are correct chain isomers of butane ? (i)
02:17View SolutionDetermine the point of symmetry of a regular hexagon.
05:41View SolutionDtermine the images of the following figure about the given line :
02:10View SolutionMatch the following Column A to Column B
 02:17View Solution
Match the following Column A to Column B
 02:10View Solution
Match the following Column A to Column B
 05:08View Solution
The inequation represented by the graph given below is :
03:12View SolutionThe inequation that best describes the graph given below is _________
04:00View SolutionThe inequation that best describes the following graph is _________
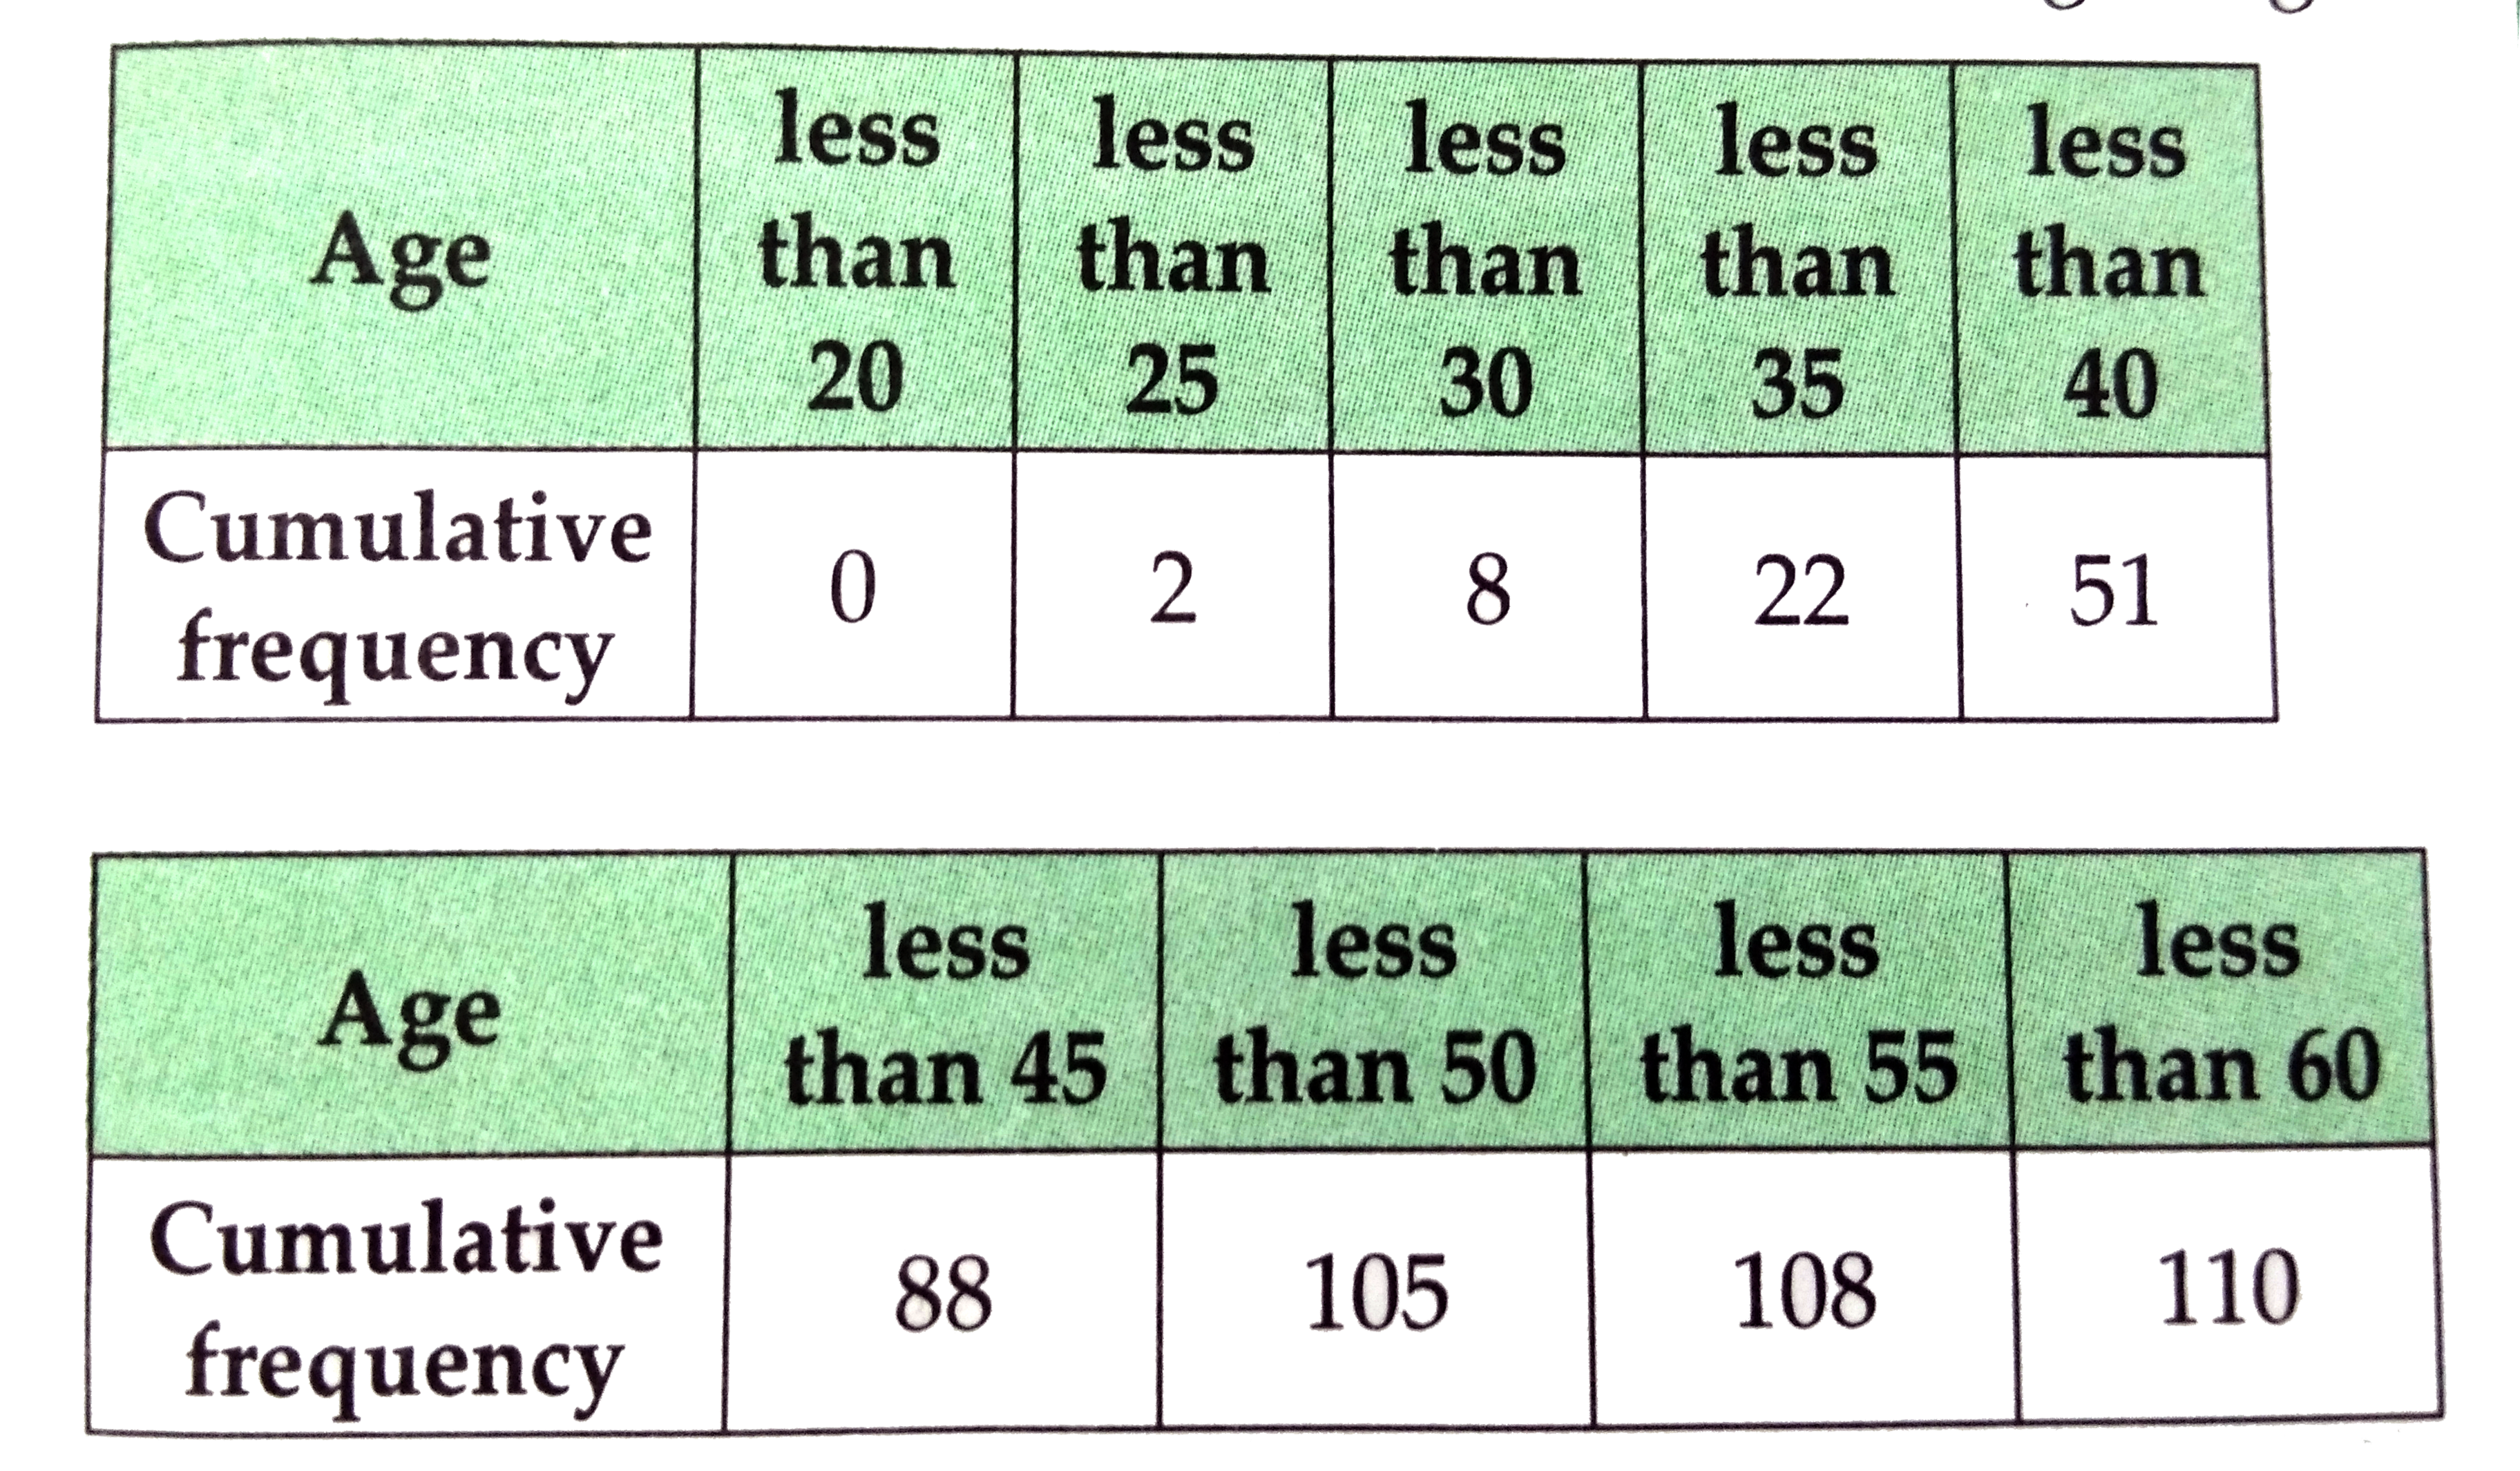
05:46View SolutionFollowing is the cumulative frequency distribution of empolyees in a certain office according to age.

Find the median age of empolyee.06:52View Solution

