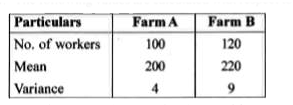
The following values are calculated with respect to the wages of workers in two farms A and B.

(i) Find the coeffcient of variation of farm A and farm B .
(ii) Which farm shows more variability ?
(iii) Which farm shows more consistency?Solution in Tamil
Step by step video & image solution for The following values are calculated with respect to the wages of workers in two farms A and B. (i) Find the coeffcient of variation of farm A and farm B . (ii) Which farm shows more variability ? (iii) Which farm shows more consistency? by Maths experts to help you in doubts & scoring excellent marks in Class 12 exams.
Updated on:21/07/2023Topper's Solved these Questions
- STATISTICSBOOK - NEW JOYTHI PUBLICATIONCHAPTER - STATISTICSEXERCISE - EXSERCISE
34 Videos
- STATISTICSBOOK - NEW JOYTHI PUBLICATIONCHAPTER - STATISTICSEXERCISE - QUESTIONS FROM COMPETITIVE EXAMS
40 Videos
- SETSBOOK - NEW JOYTHI PUBLICATIONCHAPTER - SETSEXERCISE - QUESTIONS FROM COMPETITIVE EXAMS
21 Videos
- STRAIGHT LINESBOOK - NEW JOYTHI PUBLICATIONCHAPTER - STRAIGHT LINESEXERCISE - QUESTIONS FROM COMPETITIVE EXAMS
122 Videos
Similar Questions
The A . M first 'n' natural numbers is
View SolutionThe mean mark in Statistics of 100 students in a class was 72 .The mean mark of boys was 75, while their number was 70. The mean mark of girls in the class was
View SolutionIf A and B are not disjoint sets then n(A∪B) is equal to
View SolutionThe incentre of the triangle ABC where A(-36, 7) B (20,7) and C (0,-8) is
View SolutionWhich of the following are correct chain isomers of butane ? (i)
View SolutionDetermine the point of symmetry of a regular hexagon.
View SolutionMatch the following Column A to Column B

View SolutionMatch the following Column A to Column B

View SolutionMatch the following Column A to Column B

View SolutionThe inequation represented by the graph given below is :
View SolutionThe inequation that best describes the graph given below is _________
View SolutionThe inequation that best describes the following graph is _________
View SolutionIn the given figure, PQRS is a parallelogram. A and B are the mid-point of ¯¯¯¯¯¯PQ and ¯¯¯¯¯SR respectively. If PS=BR, then the quadrilateral ADBC is a…………………… ,
ltimg src="https://d10lpgp6xz60nq.cloudfront.net/physics_images/PS_MATH_IX_C12_E05_020_Q01.png" width="80%"gt
View SolutionIn the chemical reactions,
ltimg src="https://d10lpgp6xz60nq.cloudfront.net/physics_images/JM_10_CHE_P1_E01_009_S01.png" width="80%"gt
the compounds 'A' and 'B' respectively are
View SolutionMatch the followings (column I with column II)
ltimg src="https://d10lpgp6xz60nq.cloudfront.net/physics_images/NCERT_BIO_XI_C03_E01_011_Q01.png" width="80%"gt
View Solution
