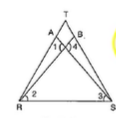
కింది పటంలో ∠1=∠3,∠2=∠4 మరియు ∠3=∠4 అయిన యూక్లిడ్ సామాన్య భావనలను అనుసరించి ∠1మరియు∠2 ల మధ్య సంబంధాన్ని రాయండి.

Step by step video & image solution for కింది పటంలో /_1=/_3, /_2 = /_4 మరియు /_3 = /_4 అయిన యూక్లిడ్ సామాన్య భావనలను అనుసరించి /_1 మరియు /_2 ల మధ్య సంబంధాన్ని రాయండి. by Maths experts to help you in doubts & scoring excellent marks in Class 9 exams.
Updated on:21/07/2023Topper's Solved these Questions
- జ్యామితీయ మూలాలుBOOK - VGS PUBLICATION-BRILLIANT(TELUGU)CHAPTER - జ్యామితీయ మూలాలుEXERCISE - Exercise
47 Videos
- జ్యామితీయ నిర్మాణాలుBOOK - VGS PUBLICATION-BRILLIANT(TELUGU)CHAPTER - జ్యామితీయ నిర్మాణాలుEXERCISE - Exercise
27 Videos
- త్రిభుజాలుBOOK - VGS PUBLICATION-BRILLIANT(TELUGU)CHAPTER - త్రిభుజాలుEXERCISE - Exercise
89 Videos
Similar Questions
కింది వానికి జవాబులు ఇవ్వండి. ఘనాలకు ఎన్ని కొలతలు ఉంటాయి?
View Solutionమూలబిందువు వద్ద దత్త కిరాణం పై కింది కోణాలను నిర్మించి, నిరూపణ చేయండి. 90∘
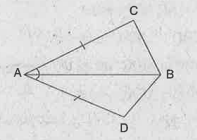
View Solutionచతుర్భుజం ABCD లో , AC=AD మరియి ∠A కు AB కోన సమద్విఖండన రేఖ అయిన ΔABC=ΔABD అని చూపండి. BC మరియు BD ల గురించి మీరు ఏమి చెప్పగలరు?

View SolutionProve that /_1+/_3=/_2+/_4 where ABCD is a quadrilateral.
View SolutionIn the given figure (1) If /_1=/_2 and /_2=/_3 then prove that /_1=/_3 (2) If /_1=/_3 and /_2=/_4 then prove /_A=/_C (3) If /_1=/_3,/_2=/_4 and /_3=/_4 write the relation between /_1 and /_2 using Euclids axiom
View SolutionIn the given figure,AC is the bisector of /_BAD. Find the measures of /_1,/_2,/_3,/_4
View Solution3.In the following figure,the line AB|CD|EF. Find the measures of /_1,/_2,/_3, and /_4
View SolutionIn Figure, it is given that RT=TS, ∠1=2∠2 and ∠4=2∠3 . Prove that RBT ≅ SAT

View SolutionIn Fig., write another name for: ∠1 (ii) ∠2 (iii) ∠3 (iv) ∠4
View SolutionIf /_1=135^@ and /_4=45^@ then find /_2 and /_3
View SolutionDetermine the point of symmetry of a regular hexagon.
View SolutionMatch the following Column A to Column B

View SolutionMatch the following Column A to Column B

View SolutionMatch the following Column A to Column B

View SolutionThe inequation represented by the graph given below is :
View SolutionThe inequation that best describes the graph given below is _________
View Solution
