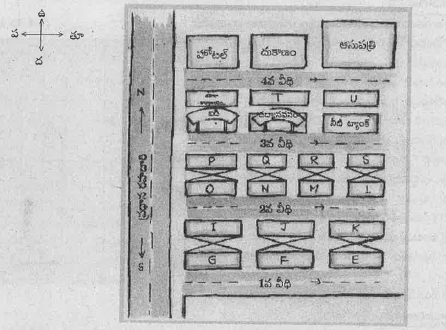
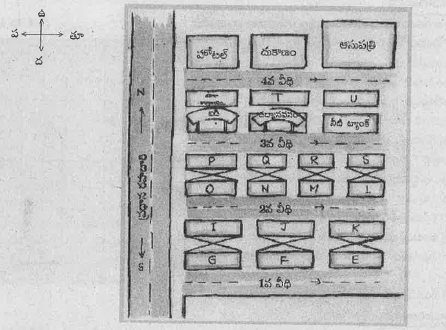
ఒక ఆవాస ప్రాంతంలో ప్రధాన రహదారి ఉత్తర-దక్షిణ దిశలలో ఉంది. దాని పటం కింది ఇవ్వబడినది. పటం సహాయంతో కింది ప్రశ్నలకు సమాధానాలు వ్రాయండి.
 K గారి ఇల్లు ఏ స్థానంలో ఉందొ వివరించండి?
Step by step video & image solution for ఒక ఆవాస ప్రాంతంలో ప్రధాన రహదారి ఉత్తర-దక్షిణ దిశలలో ఉంది. దాని పటం కింది ఇవ్వబడినది. పటం సహాయంతో కింది ప్రశ్నలకు సమాధానాలు వ్రాయండి. K గారి ఇల్లు ఏ స్థానంలో ఉందొ వివరించండి? by Maths experts to help you in doubts & scoring excellent marks in Class 9 exams.
Updated on:21/07/2023Topper's Solved these Questions
- నిరూపక జ్యామితిBOOK - VGS PUBLICATION-BRILLIANT(TELUGU)CHAPTER - నిరూపక జ్యామితిEXERCISE - Exercise
87 Videos
- త్రిభుజాలుBOOK - VGS PUBLICATION-BRILLIANT(TELUGU)CHAPTER - త్రిభుజాలుEXERCISE - Exercise
89 Videos
- బహుపదులు మరియు కరణాంకా విభజనBOOK - VGS PUBLICATION-BRILLIANT(TELUGU)CHAPTER - బహుపదులు మరియు కరణాంకా విభజనEXERCISE - Exapmle
15 Videos
Similar Questions
ఒక ఆవాస ప్రాంతంలో ప్రధాన రహదారి ఉత్తర-దక్షిణ దిశలలో ఉంది. దాని పటం కింది ఇవ్వబడినది. పటం సహాయంతో కింది ప్రశ్నలకు సమాధానాలు వ్రాయండి.
 తూర్పుదిక్కున వెళ్లునప్పుడు మూడవవీధిలో ఎడమవైపు మూడోవస్థానంలో ఏం ఉంది?
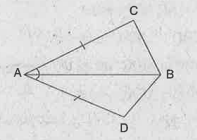
View Solutionచతుర్భుజం ABCD లో , AC=AD మరియి ∠A కు AB కోన సమద్విఖండన రేఖ అయిన ΔABC=ΔABD అని చూపండి. BC మరియు BD ల గురించి మీరు ఏమి చెప్పగలరు?

View Solutionకింద ఇవ్వబడిన బాహుపదులలో సూచించిన చరరాశి విలువను ప్రతిక్షేపించి విలువలు కనుగొనండి. X=1 వద్ద p(x)=4x2−3x+7
View SolutionHow many lines of symmetry does the above figure have ?
View SolutionWhich of the following are correct chain isomers of butane ? (i)
View SolutionDetermine the point of symmetry of a regular hexagon.
View SolutionDtermine the images of the following figure about the given line :
View SolutionMatch the following Column A to Column B

View SolutionMatch the following Column A to Column B

View SolutionMatch the following Column A to Column B

View SolutionFind the area of the figure given below.

View SolutionThe area of the shaded part in the figure given below is ______.

View SolutionThe inequation represented by the graph given below is :
View SolutionThe inequation that best describes the graph given below is _________
View SolutionThe inequation that best describes the following graph is _________
View SolutionWhich inequations represent the shaded region in the given figure
View Solution
