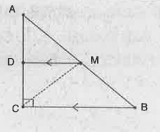
ABC లంబకోణ త్రిభుజాములో C లంబకోణం. కర్ణం AB మధ్యబిందువు M గుండా BC కు సమంతరముగా గీచిన రేఖ AC ని D వద్ద ఖండిస్తే కింది వానిని నిరూపించండి
AC మధ్య బిందువుD

Step by step video & image solution for ABC లంబకోణ త్రిభుజాములో C లంబకోణం. కర్ణం AB మధ్యబిందువు M గుండా BC కు సమంతరముగా గీచిన రేఖ AC ని D వద్ద ఖండిస్తే కింది వానిని నిరూపించండి AC మధ్య బిందువుD by Maths experts to help you in doubts & scoring excellent marks in Class 9 exams.
Updated on:21/07/2023Topper's Solved these Questions
- చతుర్భుజాలుBOOK - VGS PUBLICATION-BRILLIANT(TELUGU)CHAPTER - చతుర్భుజాలుEXERCISE - Exercise
88 Videos
- గణితములో నిరూపణలుBOOK - VGS PUBLICATION-BRILLIANT(TELUGU)CHAPTER - గణితములో నిరూపణలుEXERCISE - Exercise
104 Videos
- జ్యామితీయ నిర్మాణాలుBOOK - VGS PUBLICATION-BRILLIANT(TELUGU)CHAPTER - జ్యామితీయ నిర్మాణాలుEXERCISE - Exercise
27 Videos
Similar Questions
కింది ప్రవచనాలు సత్యమో లేదా అసత్యమో తెలపండి. ప్రతి సమాంతర చతుర్భుజము ఒక ట్రెపీజియం అగును.
View Solutionకింది వాక్యములు సత్యమో లేక అసత్యమో లేక సందిగ్ధ వాక్యమో తెలియజేస్తూ వివరించండి.ఒక నెలలో 27 రోజులు కలవు.
View Solutionమూలబిందువు వద్ద దత్త కిరాణం పై కింది కోణాలను నిర్మించి, నిరూపణ చేయండి. 90∘
View SolutionIn the given figure (not to scale), O is the centre of the circle. A,B,C and D are concyclic and AB=CD . If /_MON =120^(@) , then find /_ OPN .
View SolutionHow many lines of symmetry does the above figure have ?
View SolutionWhich of the following are correct chain isomers of butane ? (i)
View SolutionDetermine the point of symmetry of a regular hexagon.
View SolutionDtermine the images of the following figure about the given line :
View SolutionIn the figure above (not to scale), ¯¯¯¯¯¯AB⊥¯¯¯¯¯¯CDandAD is the bisector of ∠BAE.AB=3cm and AC=5cm. Find CD.
View SolutionMatch the following Column A to Column B

View SolutionMatch the following Column A to Column B

View SolutionMatch the following Column A to Column B

View SolutionThe inequation represented by the graph given below is :
View SolutionThe inequation that best describes the graph given below is _________
View SolutionThe inequation that best describes the following graph is _________
View SolutionWhich inequations represent the shaded region in the given figure
View Solution
